Charts allow you to present data entered into a worksheet in a visual format, using a variety of graph types. Before you can make a chart you must first enter data into a worksheet.
The Chart Wizard
To create a chart:
- StepsActions
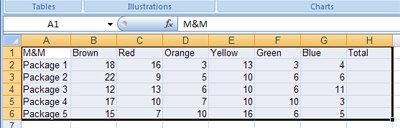
- Enter your data into a worksheet.
- Select the cells that you want to include in the chart, including the headings.
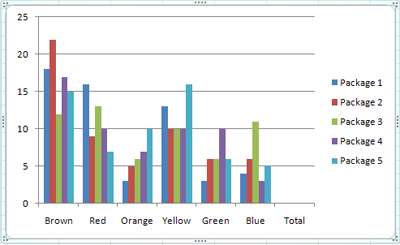
- Click the Insert tab. In the Charts group, Excel provides you with a number of different chart type options: column, line, pie, bar, area, scatter, or other chart.
- Once you have clicked the chart type you want, a menu will open showing more available chart styles within that type.
- Click the chart style you want. The chart will open in your worksheet.
Resizing a Chart
To resize your chart:
- StepsActions
- Click the chart to select it. A border with eight handles will appear around the chart box.
- Click one of the handles and drag the chart to its new size.
Moving a Chart
To move the chart to another location on your spreadsheet:
- StepsActions
- Click the chart to select it.
- Place your mouse over the border of the chart box until the cursor changes to a
 .
. - Click and drag the chart to its new location.
Moving Chart Elements
You can also move elements within the chart, for example the title, labels, and graphics. To move elements within a chart:
- StepsActions
- Click the element you want to move. A border will appear around it.
- Hold the mouse over the border until the cursor changes to a
 .
. - Move the element to its new location.
Formatting a Chart
Once you have created a chart, or once your chart is selected, the Chart Tools bar will appear across the ribbon. The Chart Tools bar has three tabs that are useful for modifying and customizing your chart, the Layout, Design, and Format tabs. The Layout tab allows you to change the axes and gridlines of a chart, to align the labels and chart legend, and to format the background of a chart. The Design tab allows you to change the style of your chart. The Format tab allows you to change the style of your chart elements, for example the shape and text styles. Below, we have included a short list of more specific functions that can be accessed from the Design, Layout and Format tabs.
Format Selection – To select an object on the chart to format, click the object on the chart or select the object from the Chart Elements dropdown menu on the Format tab. A window containing the properties of that object will appear so that you can make formatting changes.
Chart Type – You can change the chart type by clicking the Change Chart Type button on the Design tab.
Legend – The Chart Legend button, located on the Layout tab, allows you to control where the legend is placed on your chart, or allows you to hide the legend from view.
Display Data by Column or Row – You can display your data by column or row by clicking the Switch Row/Column button on the Design tab.
Copying a Chart to Microsoft Word
A finished chart can be copied into a Microsoft Word document by following these steps:
- StepsActions
- Select the chart by clicking it.
- Click Copy.
- Open the Microsoft Word document that you want to paste the chart into.
- Click Paste.