Formulating New Priorities
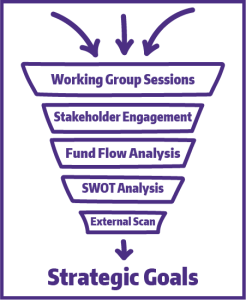
Phase 1 set up an enormous information funnel. It collected input from UW people and databases. It scoured the IT field for best practices. The result was a rich universe of alternatives UW-IT could consider adopting as goals. In Phase 2, Huron will sift this massive universe into about 50 strategic options, which will help us name our priorities for the next three years.
Huron is working with UW-IT’s Executive Leadership Team to develop a way of evaluating these strategic options. The rubric they create will rank the options using a set of weighted criteria. The rubric will be based on several factors, for example, the University’s overall goals, customer needs, industry best practices, and UW-IT values, like diversity and equity, collaboration, compassion, and commitment.
This repository of ideas may include potential initiatives, programs and investments. When the 50 or so options have been scored and ranked, we’ll have four to six at the top of the list, and they will be the focus of our strategic planning.
“Future Back” is Huron’s term for starting planning with the end point, and then working backward to identify the activities needed to the desired goal. In essence, we’ll translate the journey to the vision into a “to do” list.
How do you know if you’re making progress?
For each strategic priority there will be goals to name our aspirations and aims and to describe targets within the goal. There may also be projects or activities to describe the specific actions we need to take to hit our target on the way to achieving our goal. And for each of those there will be measurements.
“What gets measured gets done, what gets measured and fed back gets done well, what gets rewarded gets repeated.”
-John E. Jones III, president of Dickinson College
With a comprehensive analysis of UW-IT finances complete, Huron will collect hypotheses on areas for investment, within the context of the University’s activity-based budgeting model. Huron analyzed how funds flow through our organization: where they come from and where they are spent. They also looked at how our services are used and categorized.
Clearly, this was a far-reaching and deep process. We interviewed 310 individuals and engaged 44 departments in over 3,185 minutes of discussions. We reviewed 99 files and more than 688,000 lines of data. We completed an environmental scan to find best practices and emerging technologies. All this data goes into a funnel that will refine our options and will target the few we will focus on for the next three years.

