UW Profiles Release: Student Academic Performance Dashboards Updates
February 4, 2020
In collaboration with the Office of Planning and Budgeting (OPB), we updated the following three dashboards with new features:
- Undergraduate Retention and Graduation Rates
- Undergraduate Graduation Patterns and Time to Degree
- Undergraduate Student Persistence and Graduation by Year of Study
Undergraduate Retention and Graduation Rates
Table View:
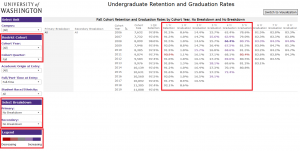
- Cohort Retention and Graduation Rates by Cohort Year was improved with the following:
- Users can select from Primary and Secondary breakdowns. Both breakdowns now include a Military Affiliation dimension.
- Color highlighting was added to show increasing and decreasing rates from previous cohort years.
- A “Cohort Year” multi-select filter was added.
- The “Variation” visualization was removed from the dashboard.
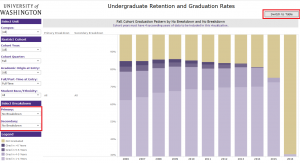
Visualization View – New!
- Cohort Graduation Pattern visualization was added
- Visualization includes the ability to select from Primary and Secondary breakdowns, which now include a Military Affiliation dimension.
- Added “Cohort Year” multi-select filter (includes cohort years with at least 4 years of data)
Other:
- The dashboard was reformatted to match UW branding guidelines
- Deceased students are no longer included in the data for this dashboard.
Undergraduate Graduation Patterns and Time to Degree
Visualization View:
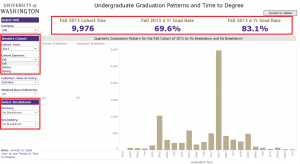
- A “Cohort Year” filter has been added, so users are now able to see the following data for a specific cohort year and quarter:
- Cohort size, 4 and 6 year graduation rates, in the new highlighted areas near the top of the dashboard
- Quarterly graduation patterns
- The “Quarterly Graduation Pattern” visualization was updated with the ability to select from Primary and Secondary breakdowns, which now include a Military Affiliation dimension.
- The following have been removed:
- Cohort Graduation Pattern visualization was moved to the Undergraduate Retention and Graduation Rates dashboard
- Time to Degree table was removed, but still displays on Table View
Table View:
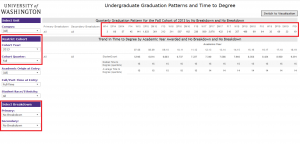
- The tables “Quarterly Graduation Pattern” and “Trend in Time to Degree by Academic Year Awarded” have been updated with the ability to select from Primary and Secondary breakdowns, which now include a Military Affiliation dimension.
- A “Cohort Year” filter was added, so that users can view the quarterly graduation pattern for a specific cohort year and quarter.
- Time to Degree is now displayed in quarters (previously it was displayed in months)
- The “Cohort Graduation Pattern” table was removed from the dashboard.
Other:
- The dashboard was reformatted to match UW branding guidelines
- Deceased students are no longer included in the data for this dashboard.
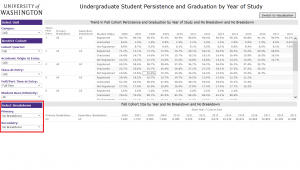
Undergraduate Student Persistence and Graduation by Year of Study
Table View:
- The tables “Trend in Cohort Persistence and Graduation by Year of Study” and the “Cohort Size by Year” have been updated with the ability to select from Primary and Secondary breakdowns.
- Primary and Secondary Breakdowns now include a Military Affiliation dimension.
Questions and Feedback:
This dashboard references many concepts like Military Affiliation and Student Academic Origin. To get detailed definitions for these and other terms, please check out Knowledge Navigator!
As always, if you have any questions, please write help@uw.edu and put “UW Profiles: Student Academic Performance Dashboards Updates” in the subject line.

