Exploring Non-Numeric Grade Values: A New Academic Dashboard in the BI Portal
December 12, 2023
As of 12/5/23, the BI Portal now includes the Non-Numeric Grade Frequency Distribution dashboard! This dashboard allows users to explore trends in grading patterns, missing grades, and other non-numeric grade outliers across UW academic departments. It reflects rolling data from the last 12 quarters and is intended for advisors, registrars and academic service leaders.
Check out the Non-Numeric Grade Frequency Distribution dashboard in the BI Portal to learn more!
What are non-numeric grade values?
These are values assigned to a student’s transcript that do not follow the standard numerical grading system (4.0 scale). The following non-numeric values are included in this dashboard:
- Incomplete
- Registrar Drop
- Missing Grade Annotations
- Satisfactory/Not Satisfactory
- Pass/Fail
- Credit/No Credit
- Honors
- High Pass
- In Progress
- Letter Grades (A – E)
Does the dashboard include any Personally Identifiable Information (PII)?
The dataset does not include any PII, meaning there is no student, staff or faculty-identifying data. The most granular level of data available is a specific Curriculum Code (for example, ENG) and Course Level (for example, 100, 200, etc.).
How do I use the dashboard?
The dashboard makes it really easy to look at data in different ways by using filters to refine the view, expose trends and drill into the details to investigate, as needed. The following is a typical use case.
Use Case – Investigate Missing Grades
A user would take the following steps to explore trends in missing grades and take action to resolve them.
- Display the Non-Numeric Grade Frequency Distribution page in the BI Portal.
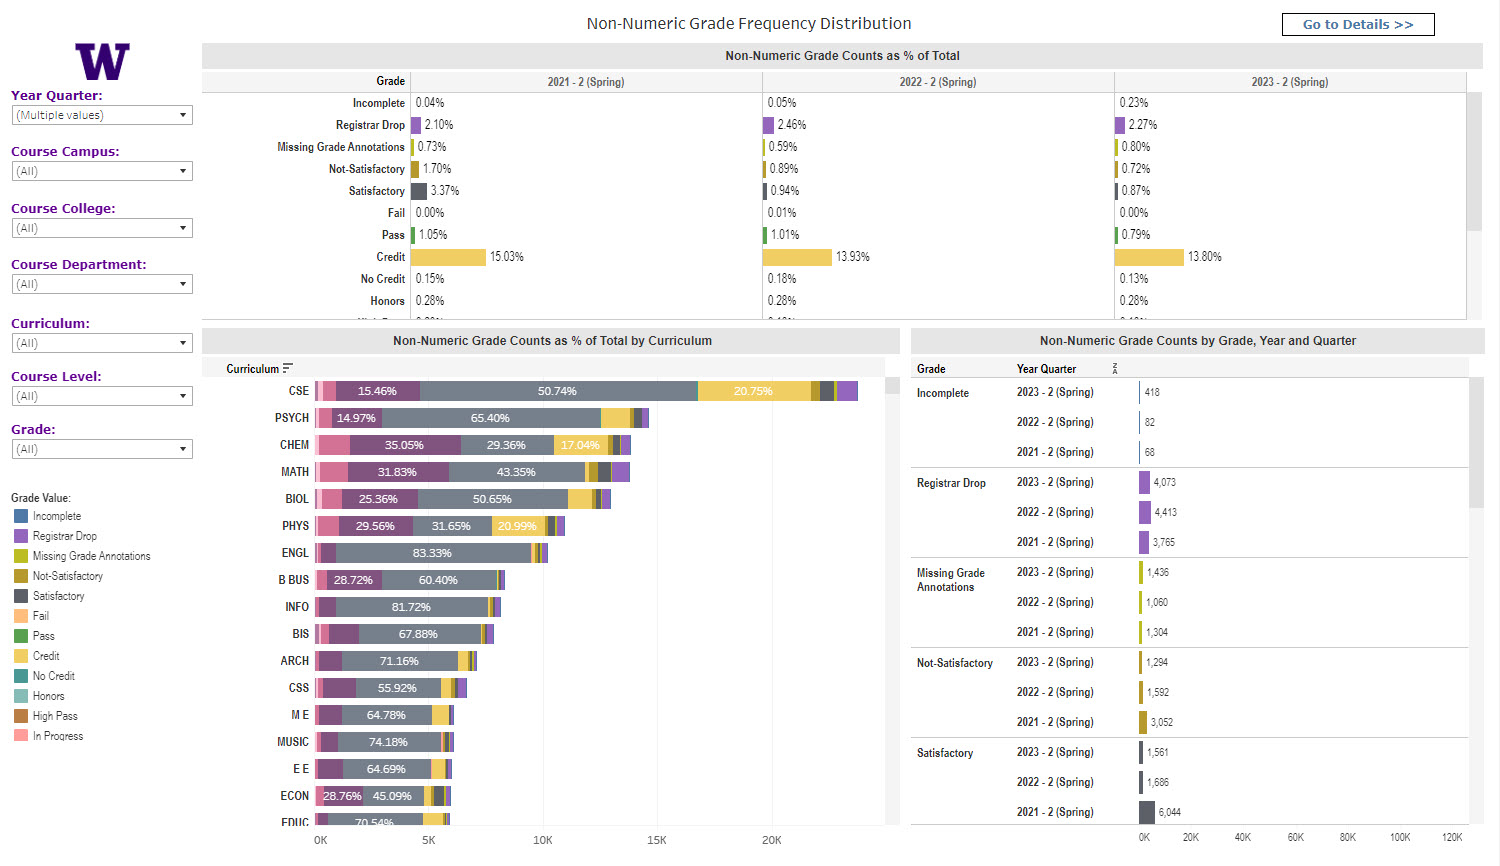
- Click Run Dashboard. The dashboard defaults to the Trends view, presenting data for non-numeric grade values in three charts for all three UW Campuses.

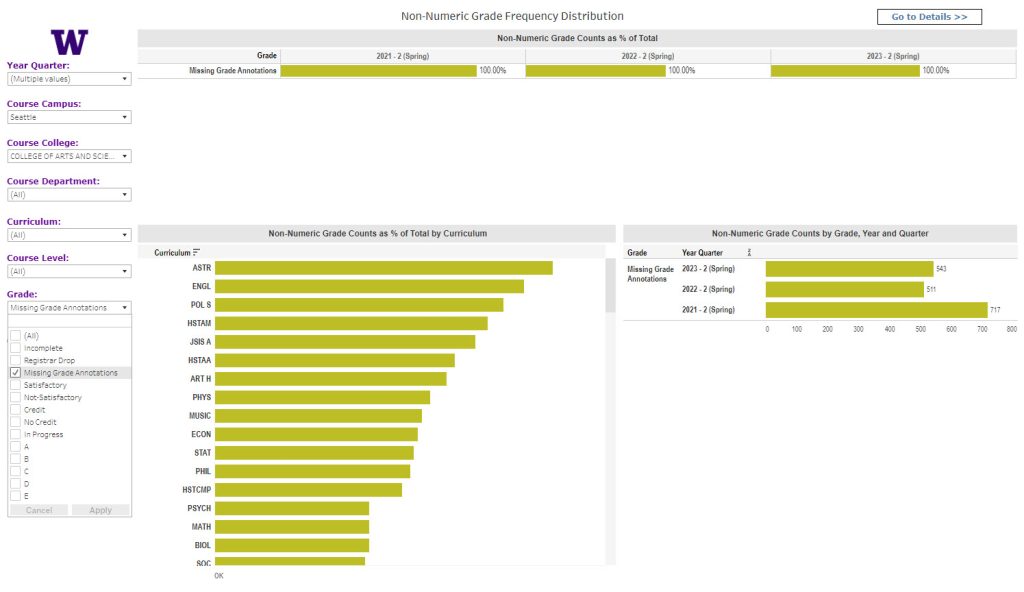
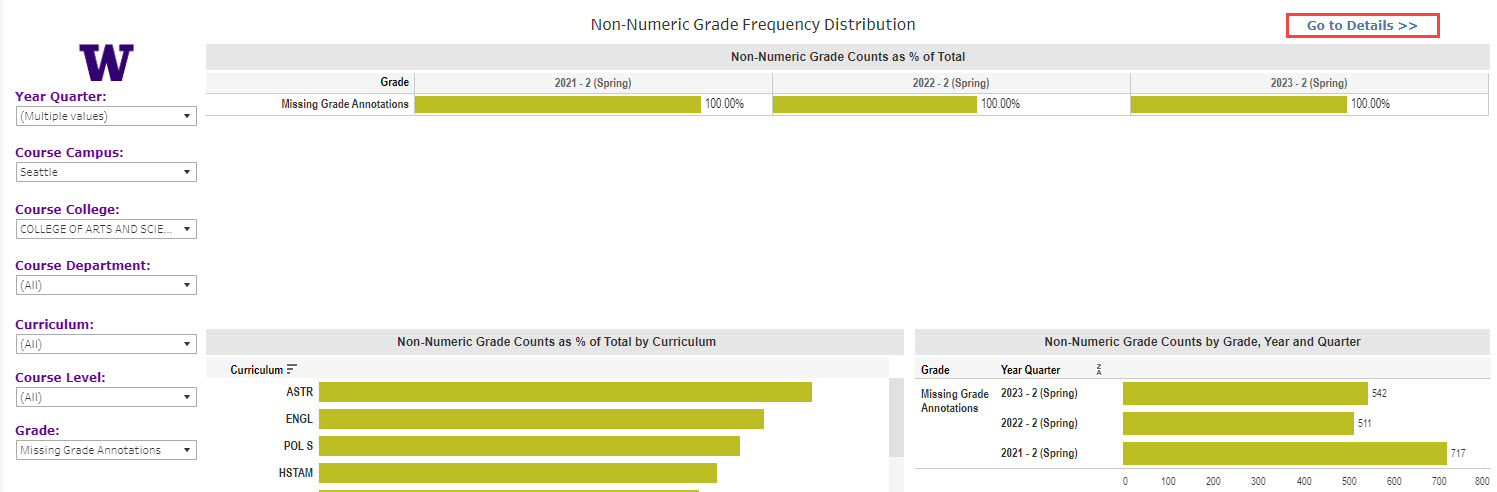
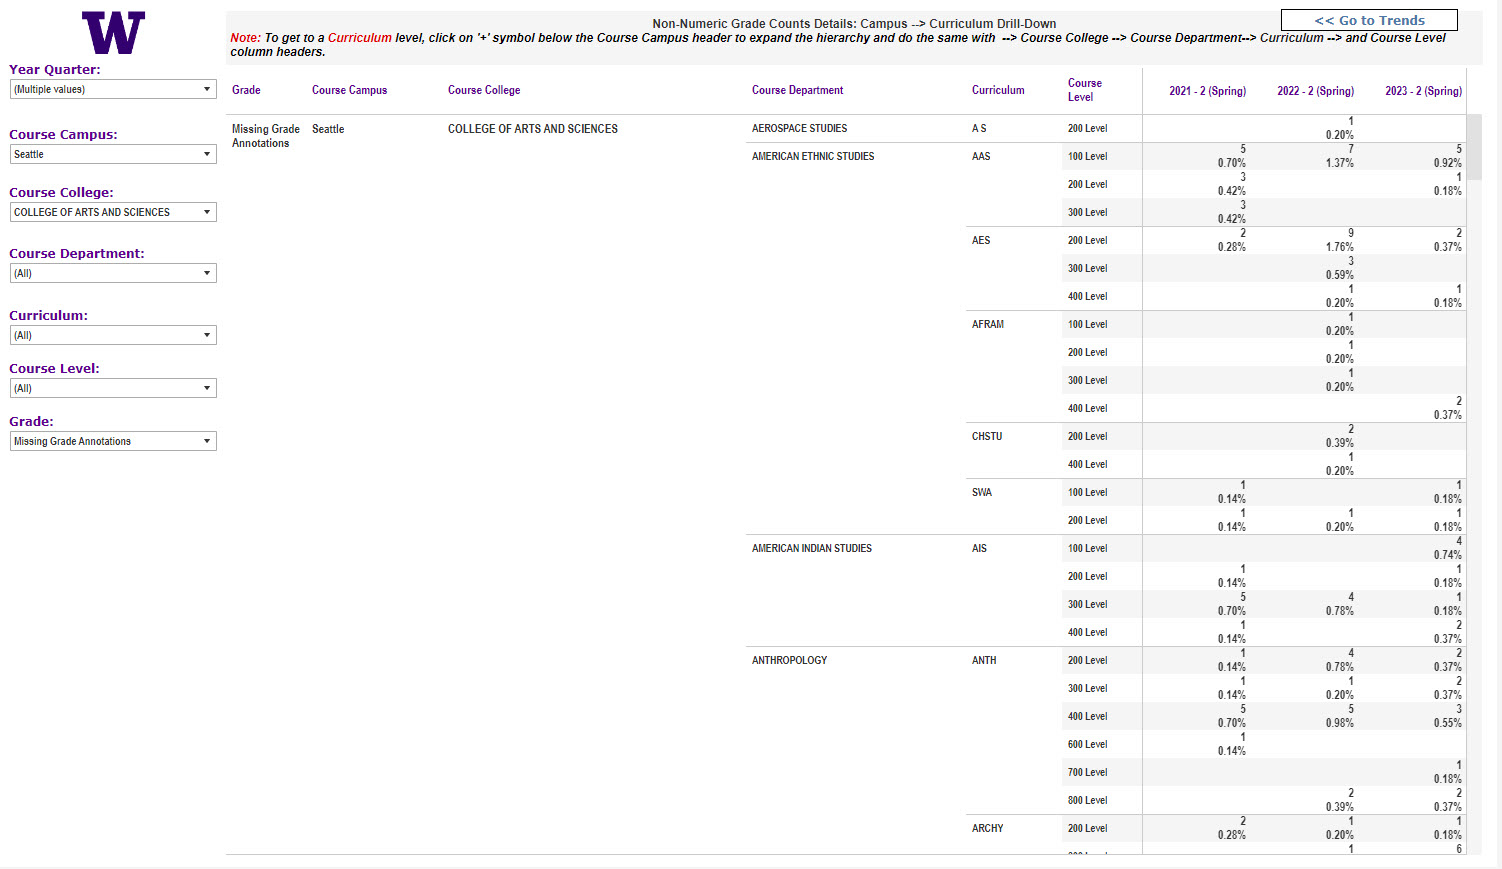
Default View of the Dashboard - In the Grade filter, select Missing Grade Annotations. Use additional filters to refine your results, as needed.
Sample Results for Missing Grade Annotations Filter - To display a detailed report of the data as a table, click Go to Details >>.
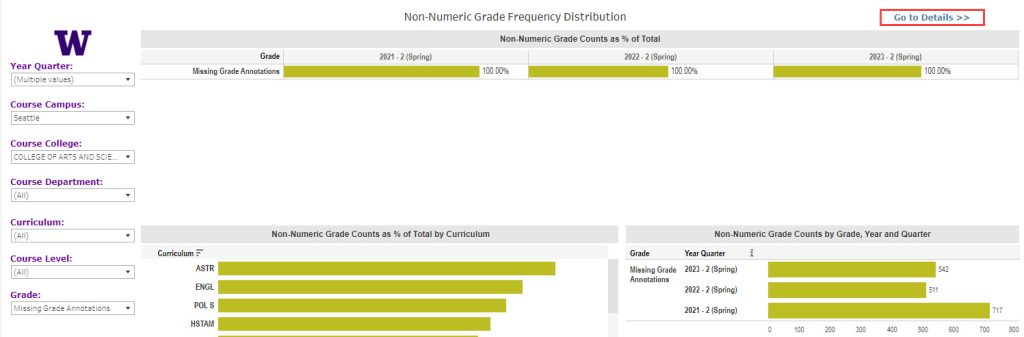
“Go to Details > >” Button 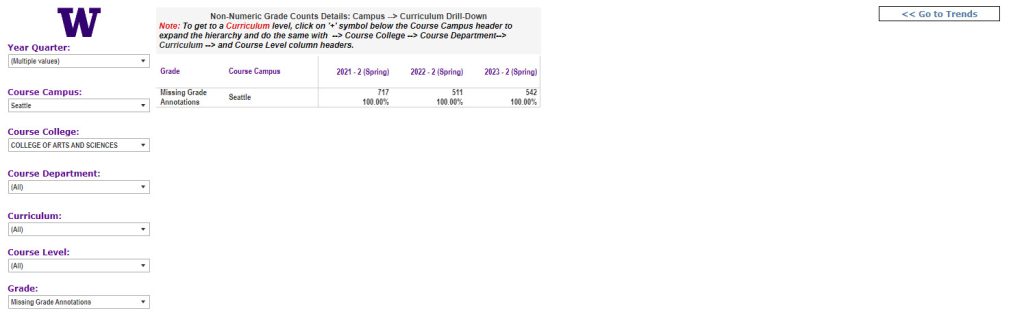
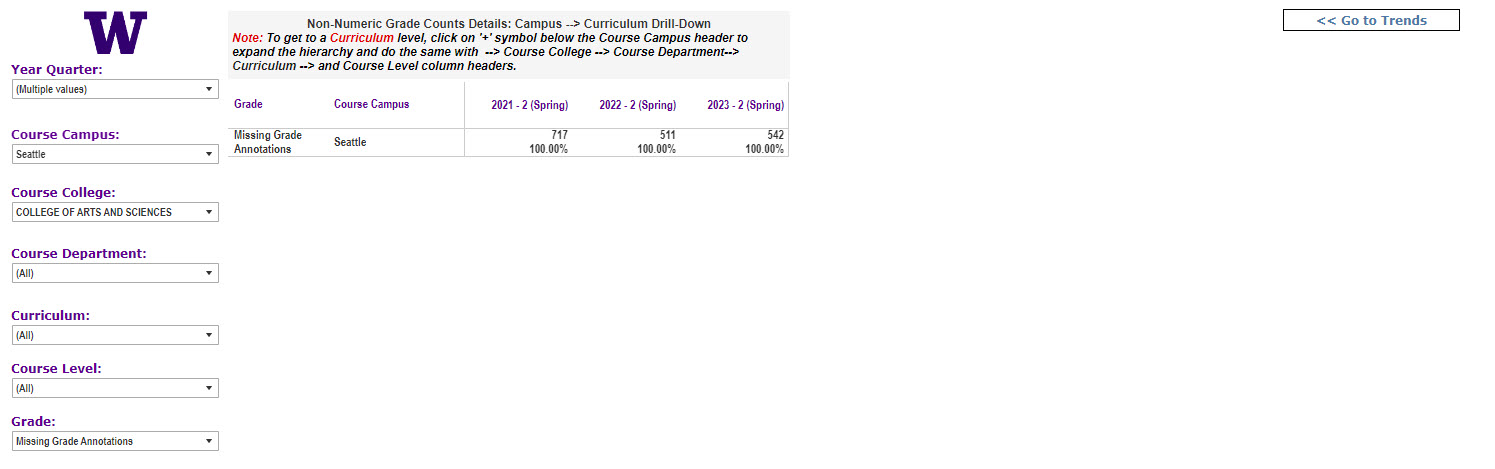
Default View of the Details Report - To expose all available data, drill down to the Course Level.
- Hover over the Course Campus column to display the plus sign (+). Click the plus sign (+) to display the Course College column.
- Repeat for the Course College column, then the Course Department column, and then the Curriculum column to display the distribution of missing grades by course level. This is the most granular level of information available in the dashboard.
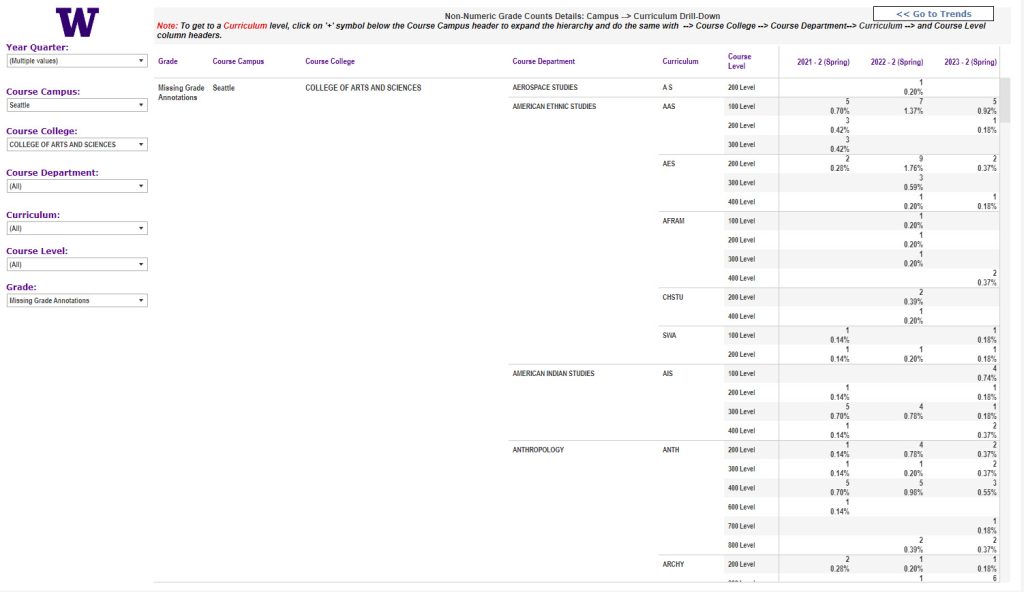
Course Level Drill Down on the Details Report
- Optional To export the data to Excel for further analysis, click the Choose a format to download icon and then select Crosstab.
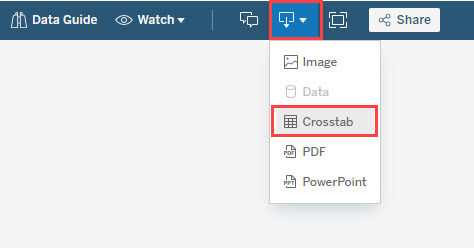
Selections to Export Data to Excel

Questions?
Please contact help@uw.edu with “BI Portal Dashboards” in the subject line.