Empowering PIs and Grant Managers: New Resources for Grant Reporting
For many Grant Managers and Principal Investigators, the implementation of Workday Finance marked the beginning of a journey—for answers, efficiencies, and reports, but most importantly, data. Along the way, these folks have come across Office Hours and Webinars, UW Connect articles and wiki pages, seeking answers and sharing gaps and pain points, all of which have supported us as we develop solutions.
While there is still more work to do, the Finance DATAGroup, with support from UW-IT Reporting & Analytics, is thrilled to announce three new Grant Reporting resources to provide clarity and support for grant management.
Introducing the New Resources
The following resources are now available (or soon to be available)!
Grant Planning and Forecasting Tool
Available Now!
The Grant Planning and Forecasting Tool is a worksheet, which calculates totals based on actual Workday data and manually entered projected values. A Grant Manager can use this tool to review actuals and track projections for a grant with the Principal Investigator (PI). This is helpful in understanding how grant funding is being spent, making projections, and then making adjustments, as needed, based on the calculations.
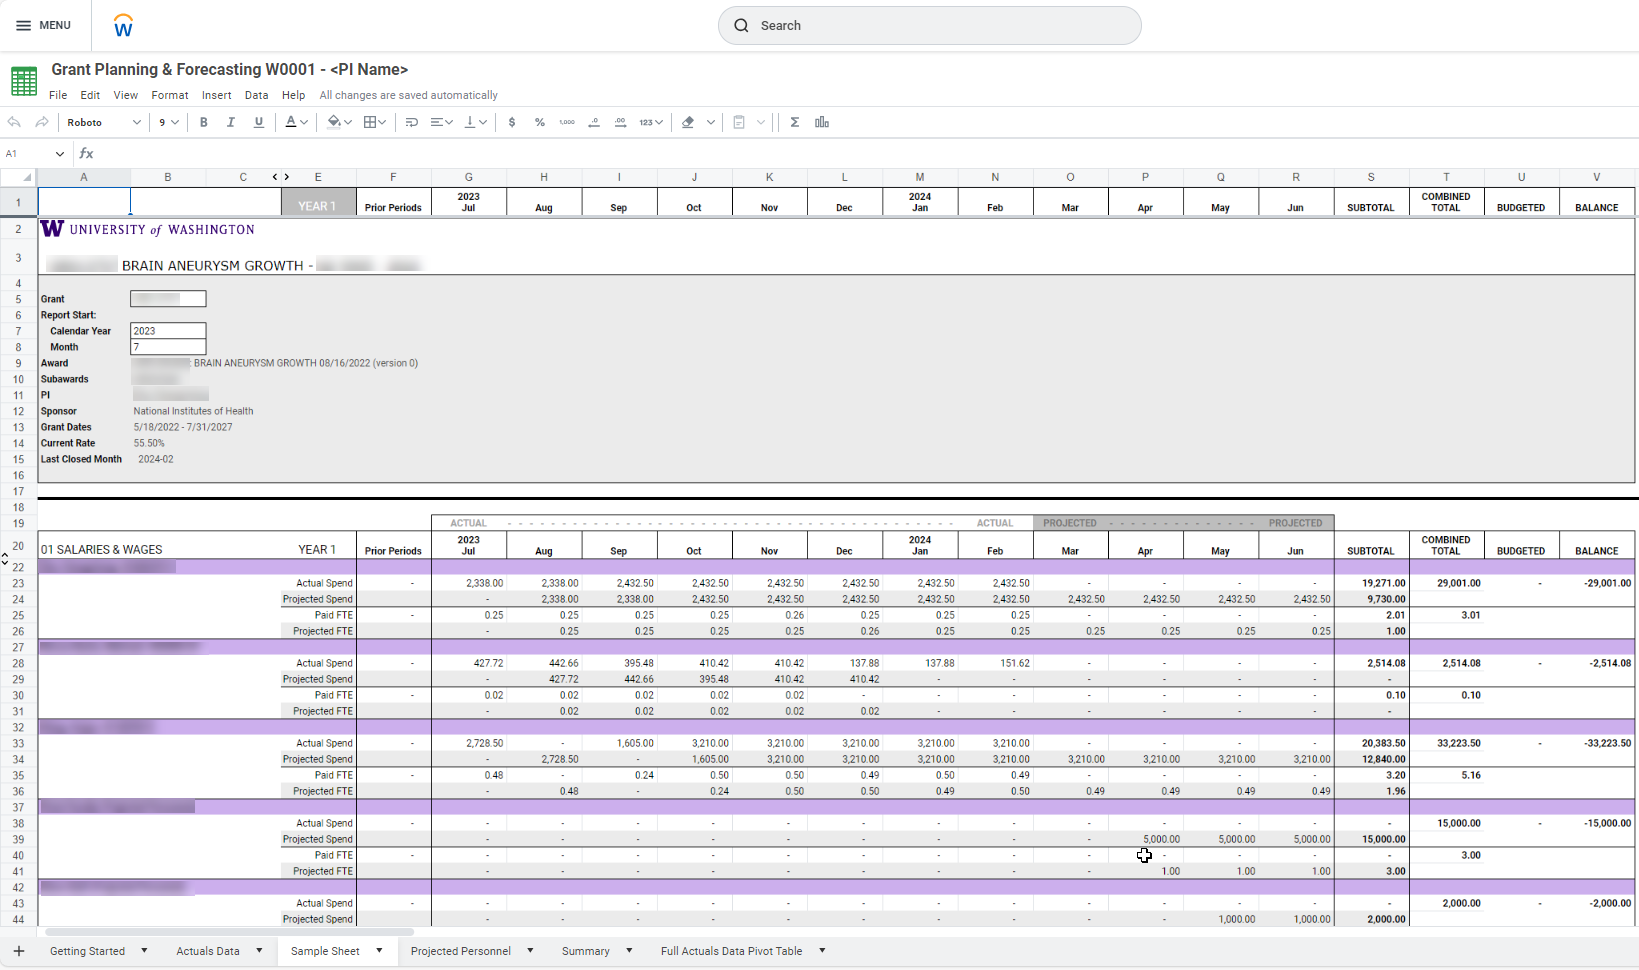
To learn more about this tool, refer to W0001 – Grant Planning & Forecasting Tool.
Note: You must be logged into Husky OnNet (VPN) in order to access the above link. For more information, refer to Husky OnNet.
Post Award Dashboard
Available Now!
The Post Award Dashboard displays grant expense and balance data in table and visual format using data available in Workday. This tool provides an alternative way to access this data for users who are not as familiar with Workday.
This dashboard was originally developed by the Office of Research to fill an urgent need for Principal Investigators (PI) and Grant Managers following Workday Go Live. This second iteration builds on the first, moving the dashboard into Tableau (our supported visualization tool), streamlining filters, tables, and visuals, pulling data directly from Workday to ensure data integrity, and incorporating feedback from a group of early adopters. This dashboard is a work-in-progress and iterative updates are expected.
This dashboard groups data into two primary views, Grant Expenses and Balance Remaining, which are explained in more detail in the following sections.
To learn more about this dashboard, refer to Post Award Dashboard.
Note: You must be logged into Husky OnNet (VPN) in order to access the above link. For more information, refer to Husky OnNet.
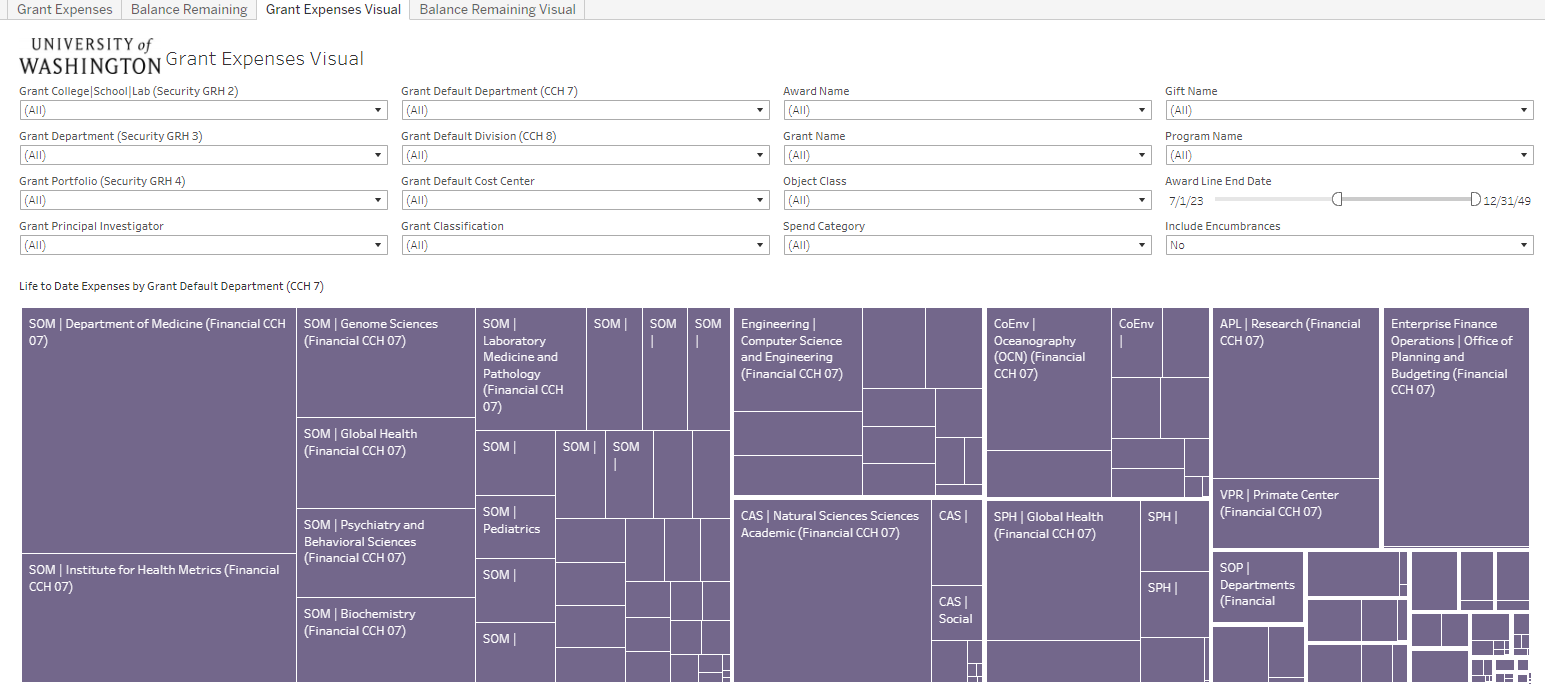
Grant Expenses
This dashboard displays Grant Expenses data in two formats: table and visual.
The table format displays grant expenses by month, beginning in July 2023, when data was loaded into Workday.
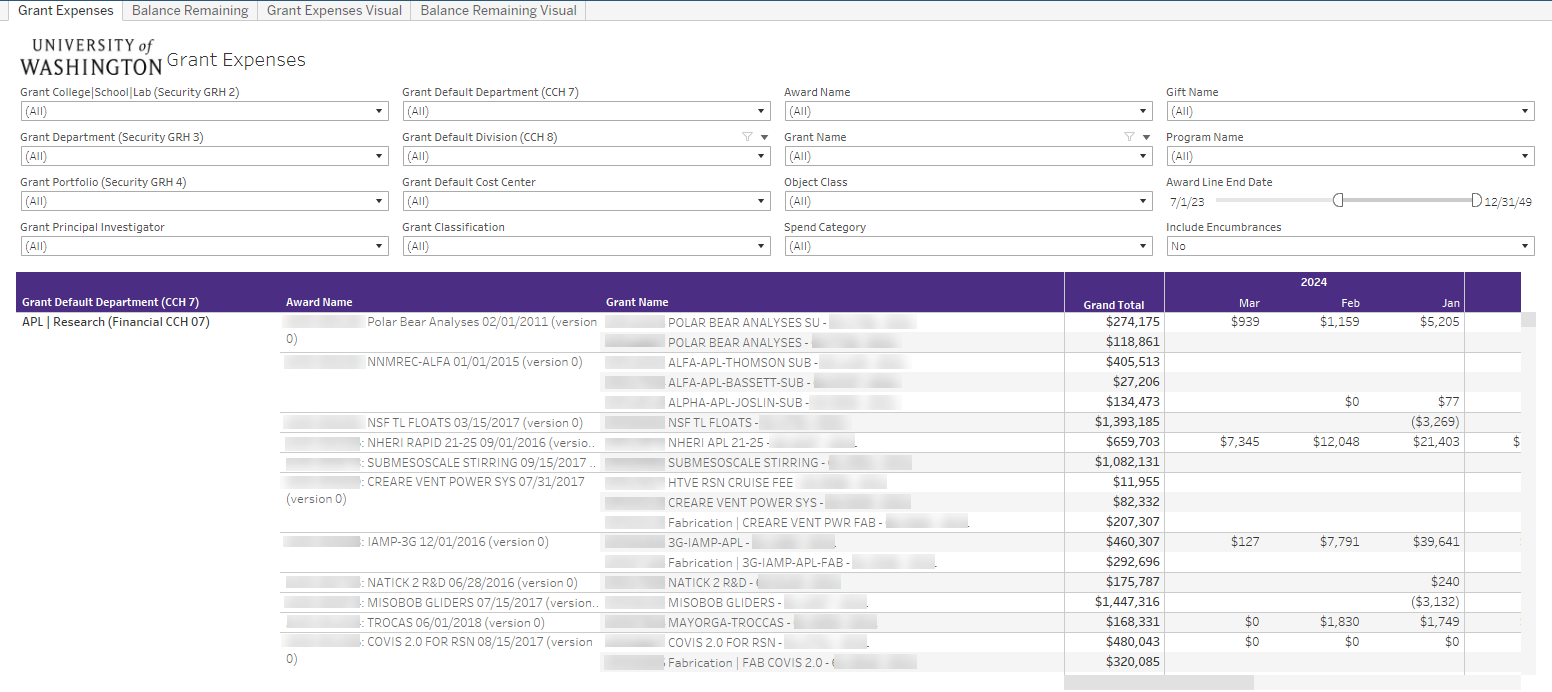
The visual format displays life-to-date grant expenses, by Grant Default Department (CCH 07). From this view, you can click on different graphical elements to drill into additional detail, if desired.
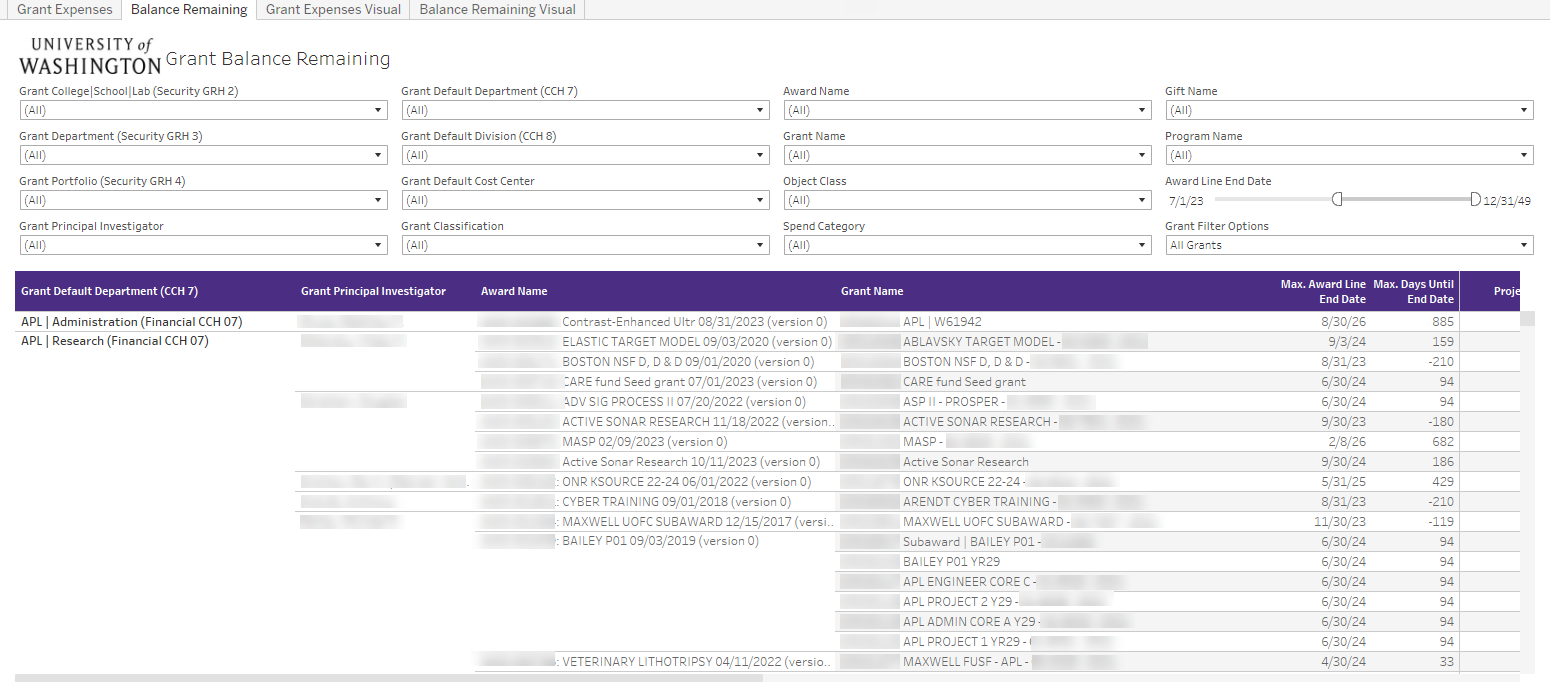
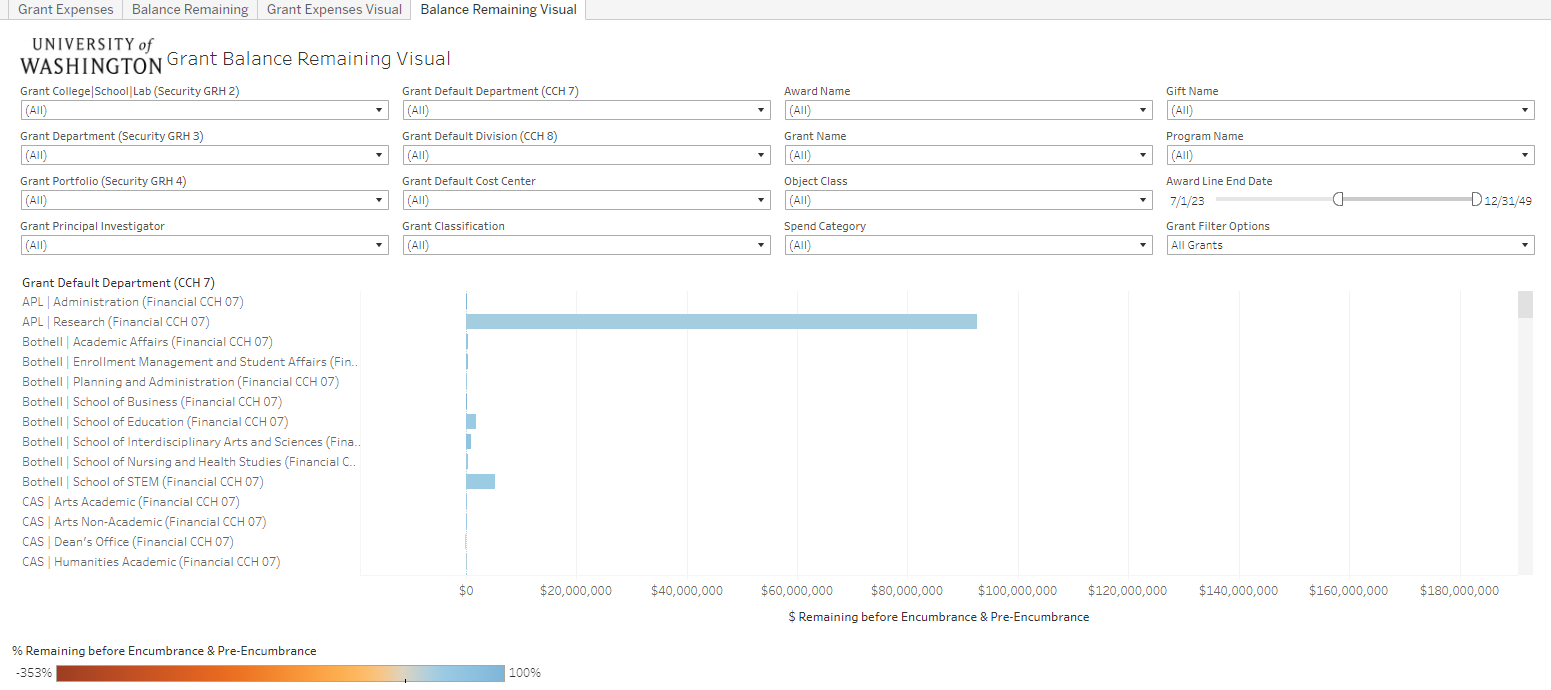
Balance Remaining
This dashboard displays Balance Remaining data in two formats: table and visual.
The table format displays the current status of a grant.
The visual format displays balance remaining data, by Grant Department From this view, you can click on different graphical elements to drill into additional detail, if desired.
Principal Investigator Dashboard
Available Soon – Expected 4/5/24
The Principal Investigator (PI) Dashboard displays grant data, which is tailored to the PI, who is logged into Workday. This gives PIs a central place to find grant-related content that is specific to them.
This dashboard splits data across six tabs—My Sponsored Grants, My Awards, My Stand Alone Grants, My Gifts, Grant Staffing, and Additional Resources—which are explained in more detail in the following sections.
Tips:
- For help finding this dashboard in Workday, refer to Finding Reports.
- For help saving this dashboard to your Apps list in Workday, refer to Customizing Workday.
Note: You must be logged into Husky OnNet (VPN) in order to access the above links. For more information, refer to Husky OnNet.
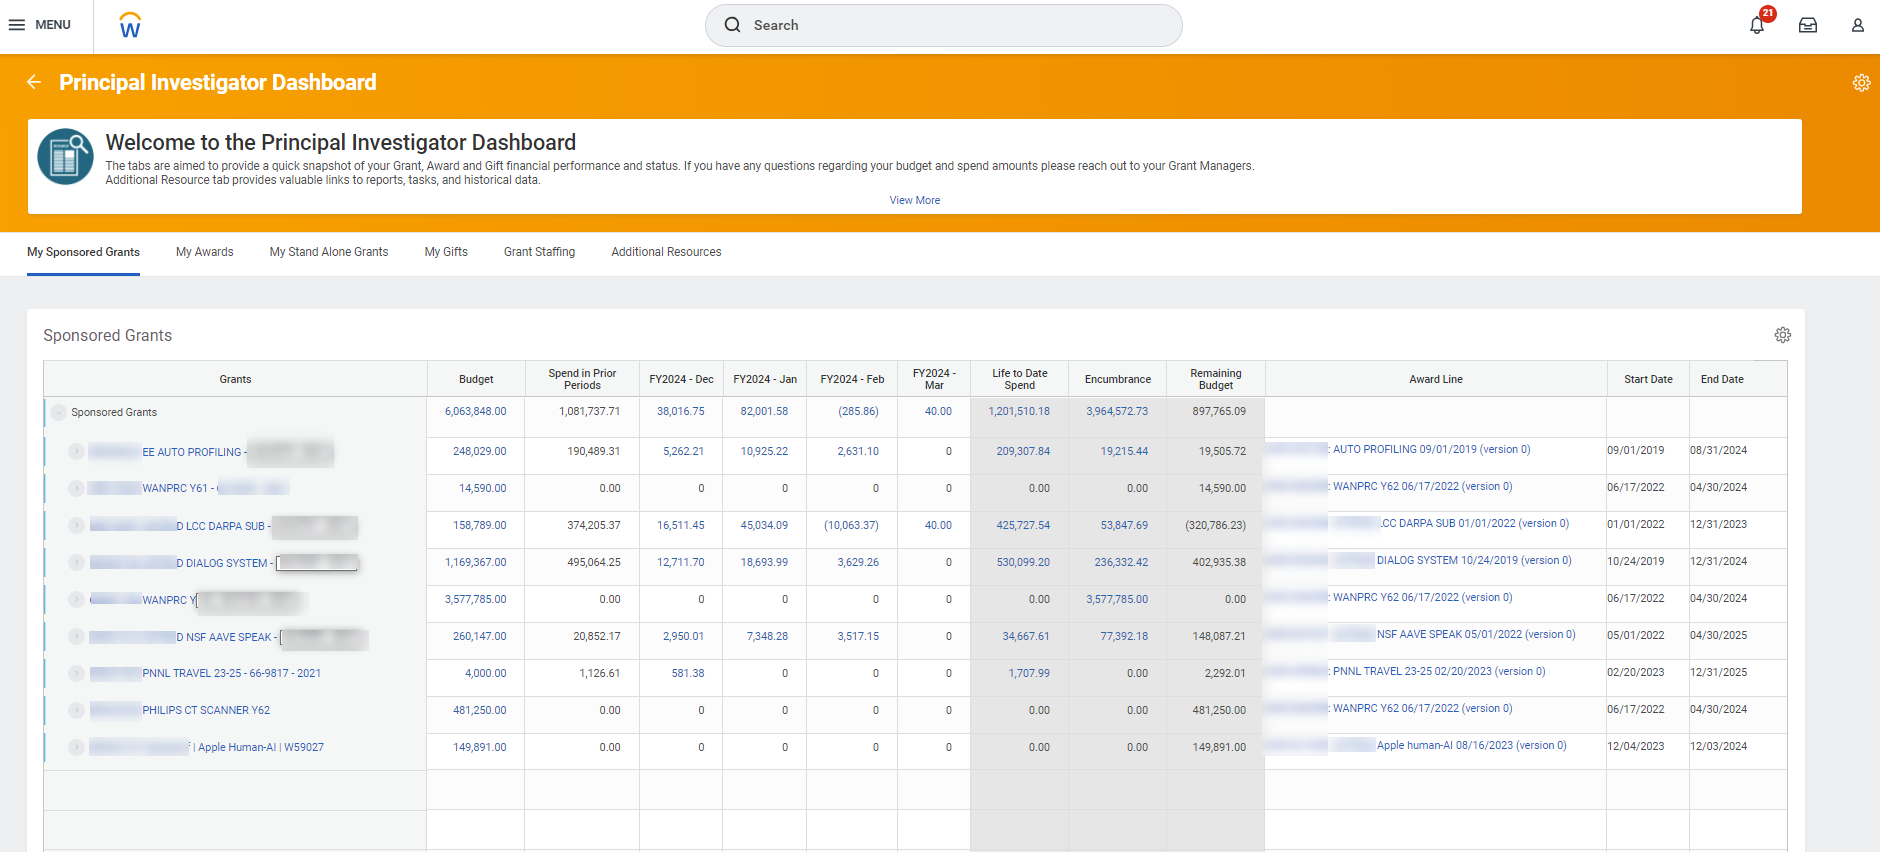
My Sponsored Grants Tab
This tab displays a snapshot of the Sponsored Grants associated with the PI, and allows the user to drill into additional detail, if needed.
Note: This tab refreshes nightly, so it reflects data from the previous day. Because this tab is not updated in real-time, you may find some discrepancies between this tab and real-time reports (for example, R1234).
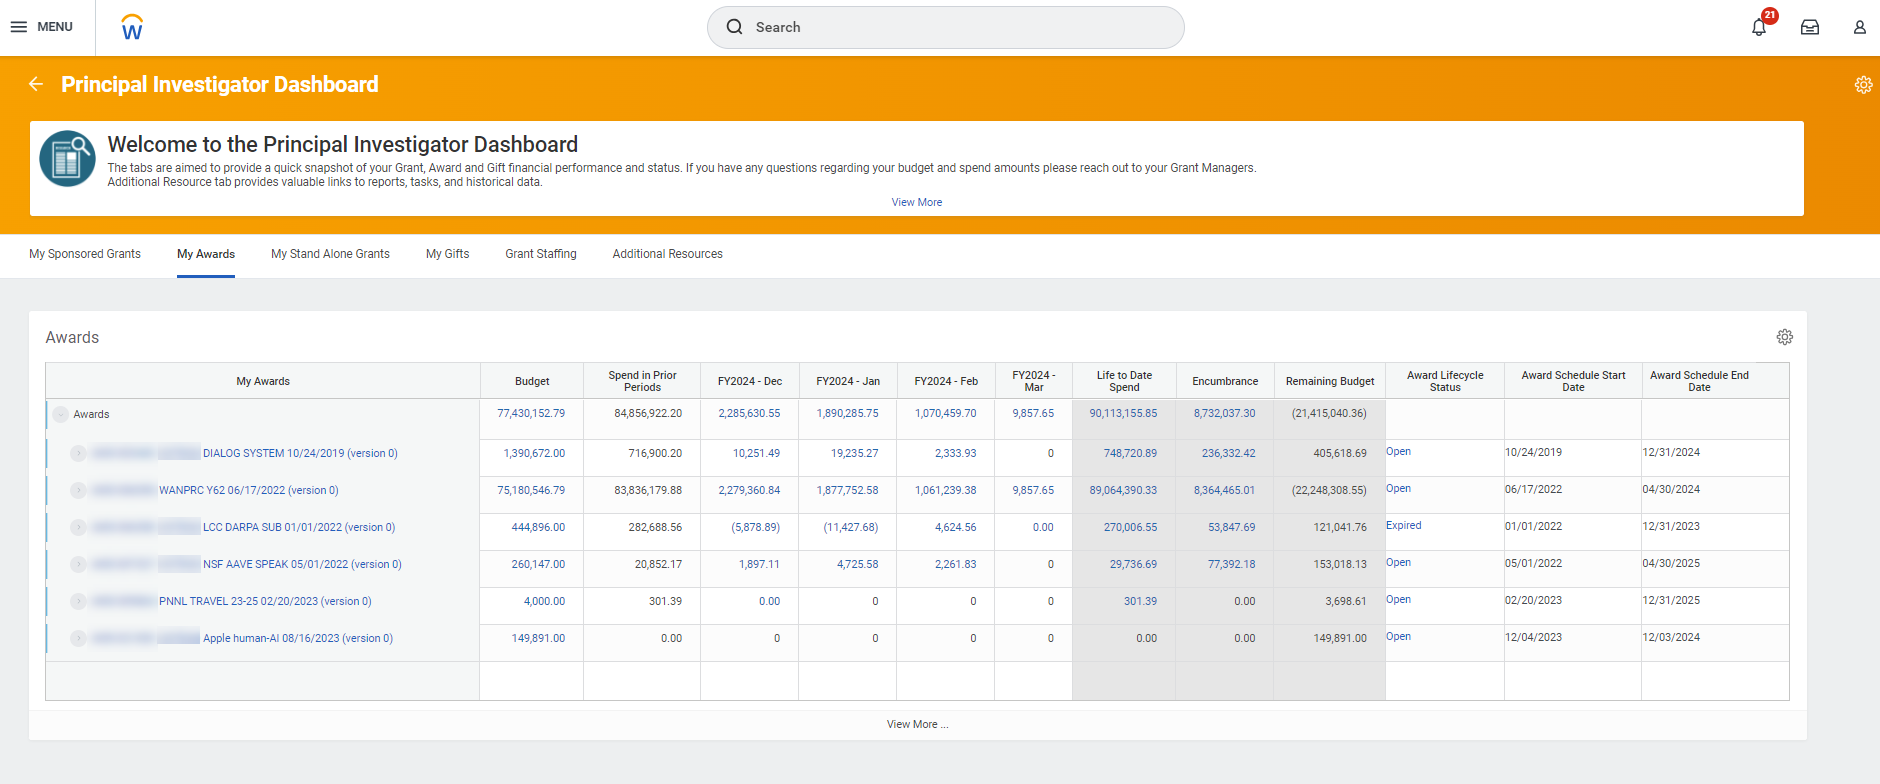
My Awards Tab
This tab displays a snapshot of the awards associated with the PI, and allows the user to drill into additional detail, if needed.
Note: This tab refreshes nightly, so it reflects data from the previous day. Because this tab is not updated in real-time, you may find some discrepancies between this tab and real-time reports (for example, R1234).
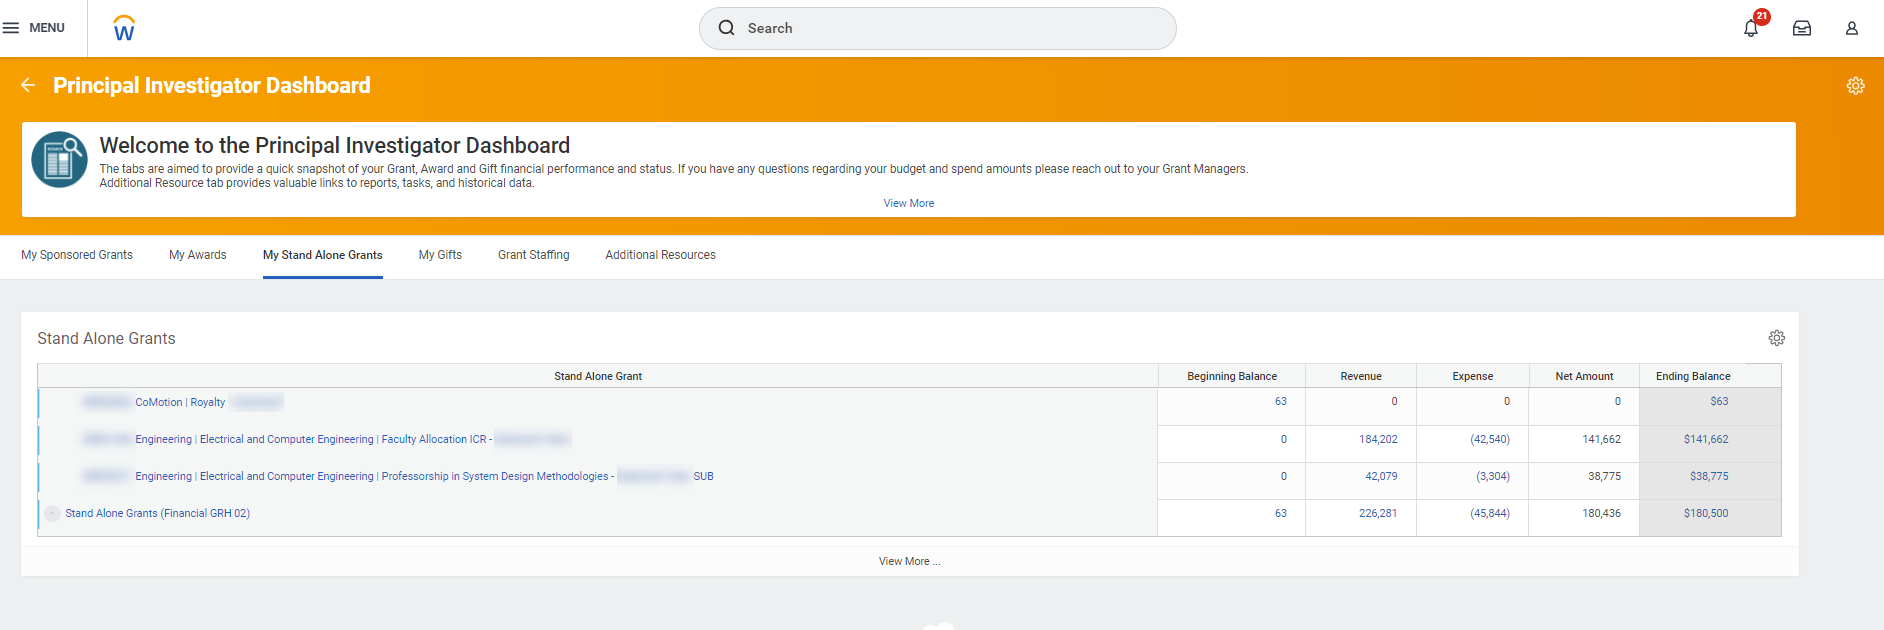
My Stand Alone Grants Tab
This tab displays a snapshot of the stand-alone grants associated with the PI, and allows the user to drill into additional detail, if needed.
Note: This tab reflects data in real-time.
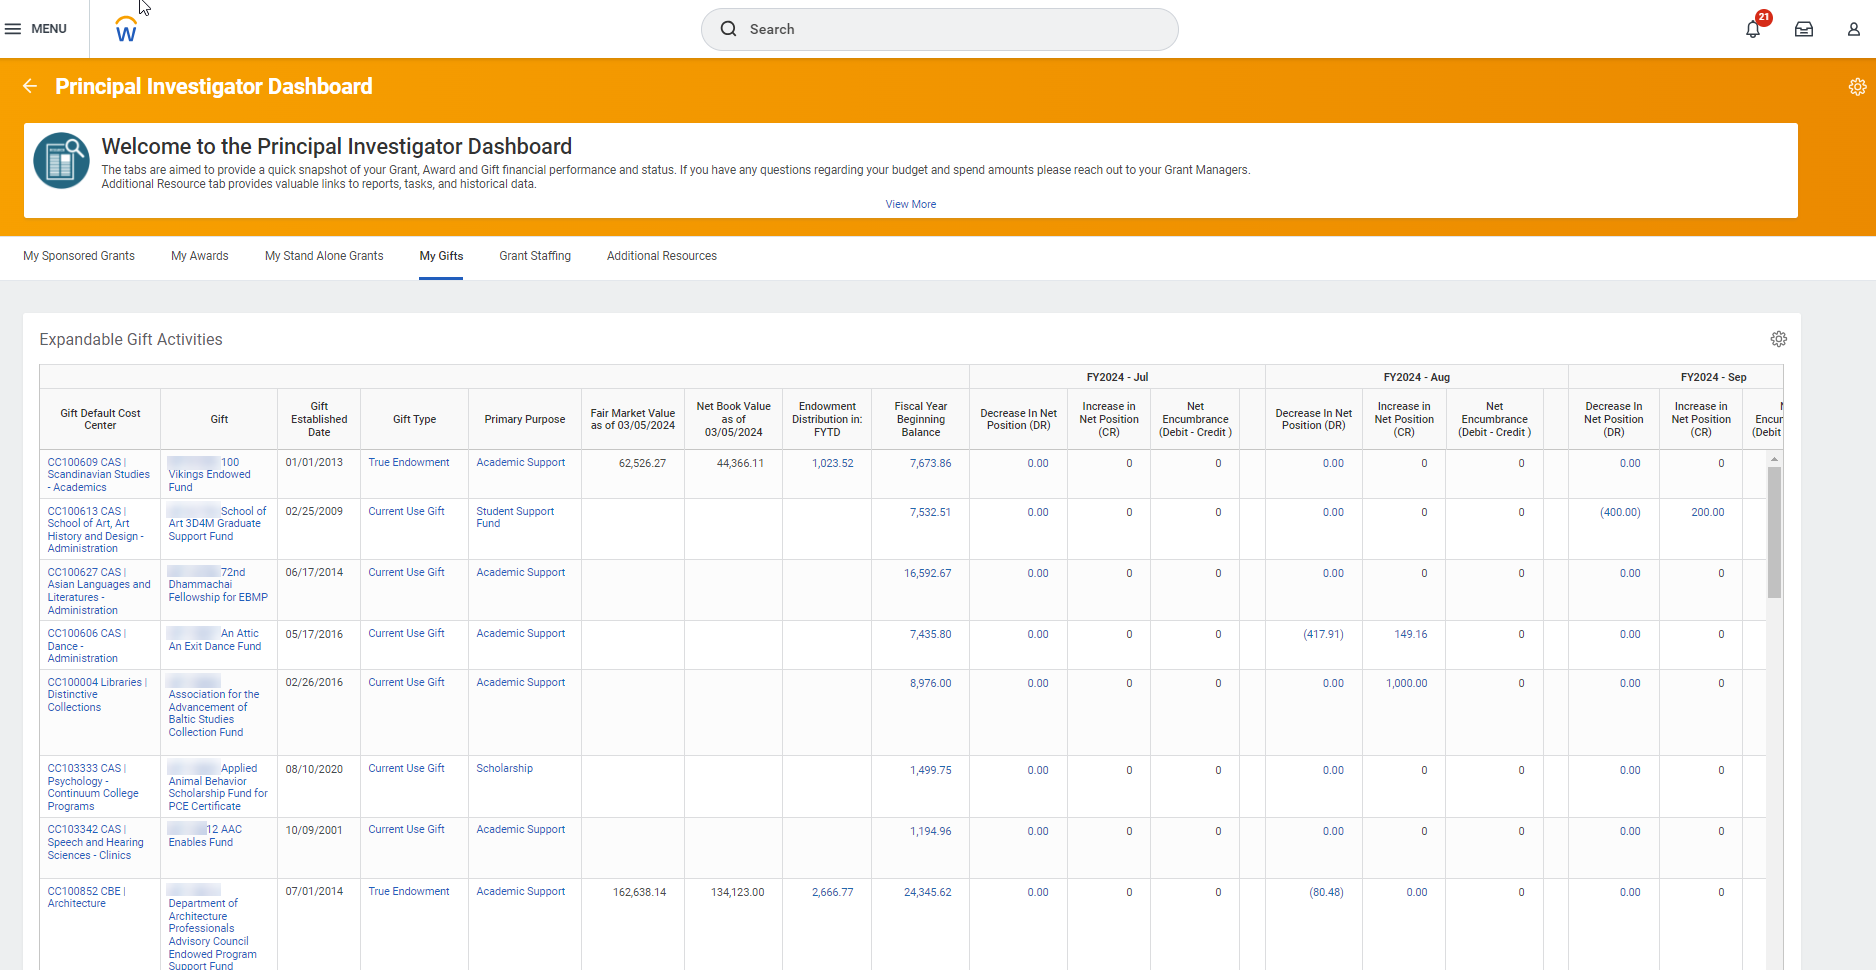
My Gifts Tab
This tab displays gifts, but unlike the other tabs, the gits that display are not specific to the PI. This tab also allows the user to drill into additional detail, if needed.
Note: This tab reflects data in real-time.
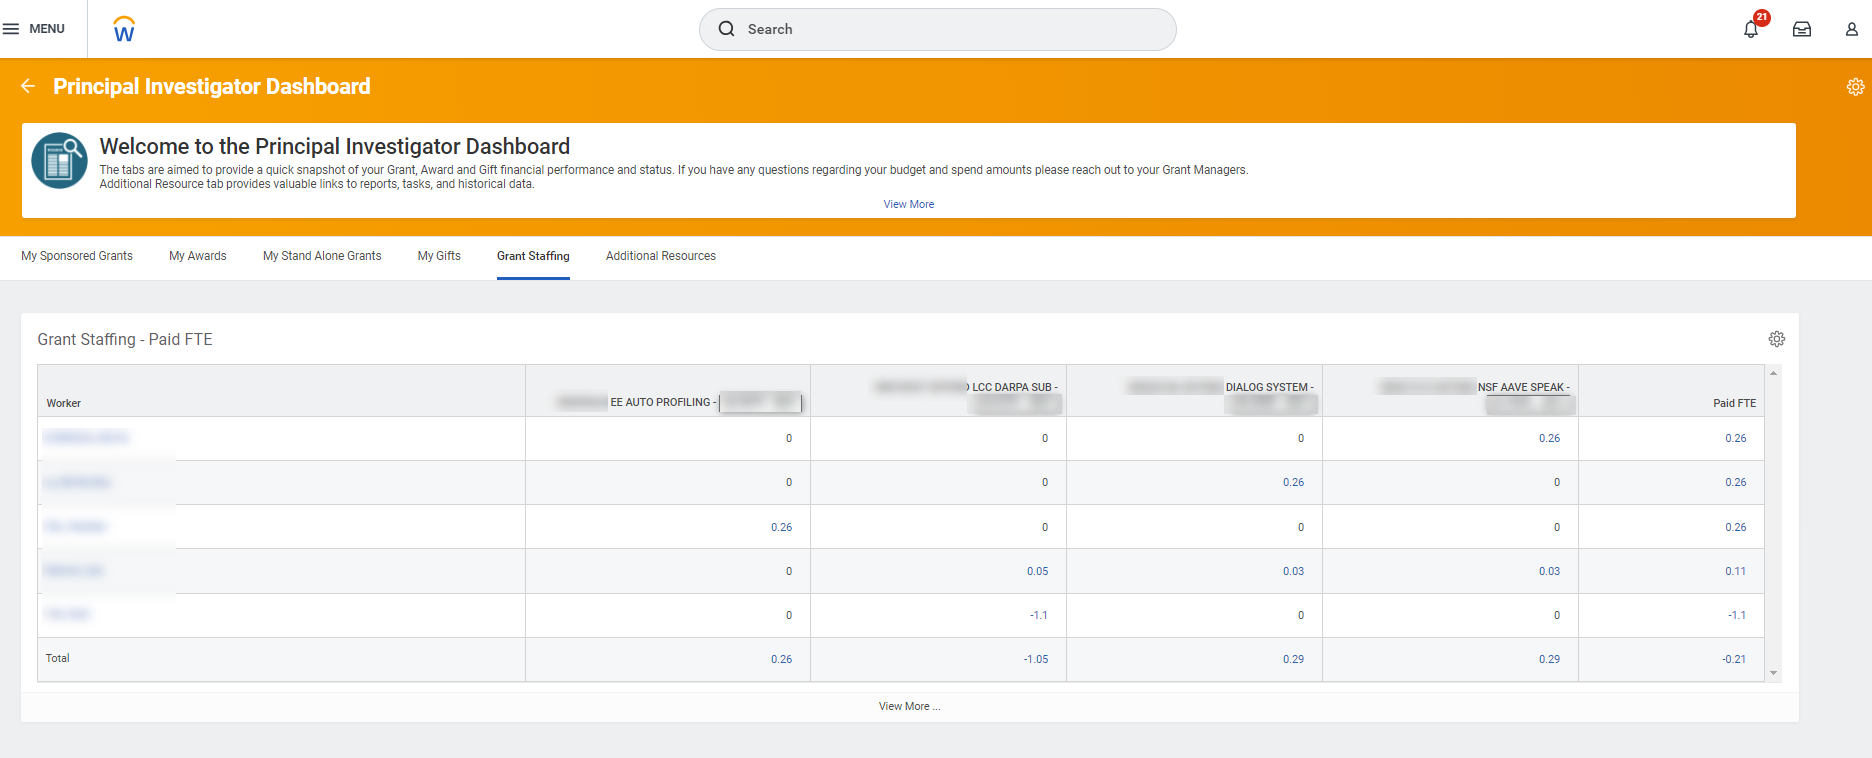
Grant Staffing Tab
This tab displays the staff working on grants associated with the PI, and allows the user to drill into additional detail, if needed.
Note: This tab refreshes nightly, so it reflects data from the previous day. Because this tab is not updated in real-time, you may find some discrepancies between this tab and real-time reports (for example, R1234).
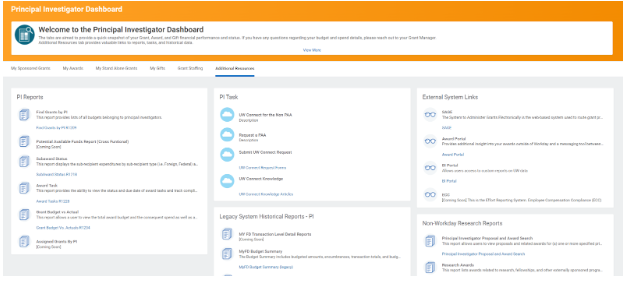
Additional Resources
This tab links out to helpful resources for the PI, including reports (Workday, research, and legacy), tasks, and other external resources.
Questions?
Please contact datagrp@uw.edu to initiate a ticket with the Finance DATAGroup.