This page helps users resolve the most common questions about working with Tableau. If your question isn’t answered here, please write help@uw.edu
- Why can’t I access Tableau visualizations (or the bitools.uw.edu server) while teleworking?
- UW Tableau Transitional Server:
- What exactly is the UW Tableau Transitional Server?
- How do I set up a project on the Transitional Server?
- How do I manage permissions for my project on the Tableau Transitional Server?
- What are the permission options for projects?
- Why am I getting errors creating or managing UW Groups?
- How do I publish to the Transitional Server and share my work with colleagues?
- How long can a visualization live on the Transitional Server?
- Why does my workbook have a “Stale Content” tag?
- What other server options are available?
- What are common Data Source issues?
- Tableau Desktop/Licensing:
- Tableau Community and Resources:
- Additional Questions:
Why can’t I access Tableau visualizations (or the bitools.uw.edu server) while teleworking?
If you are teleworking, working remotely, or are otherwise “not on the UW network”, you will not be able to access UW Tableau visualizations (on UW Profiles or BI Portal) or connect directly to the UW Tableau server (bitools.uw.edu) without first connecting to the UW Network with a VPN. We recommend using the Husky OnNet VPN supported by UW-IT. You can read about Husky OnNet, download it, and more on IT Connect: Husky OnNet
More Details:
If you are teleworking, or if you are working in your office but your department is not on the UW network, when you try to connect to the UW Tableau Server, you’ll see an error like the one below. This can happen whether you attempt to connect directly to the server (bitools.uw.edu) or through UW Profiles or BI Portal.
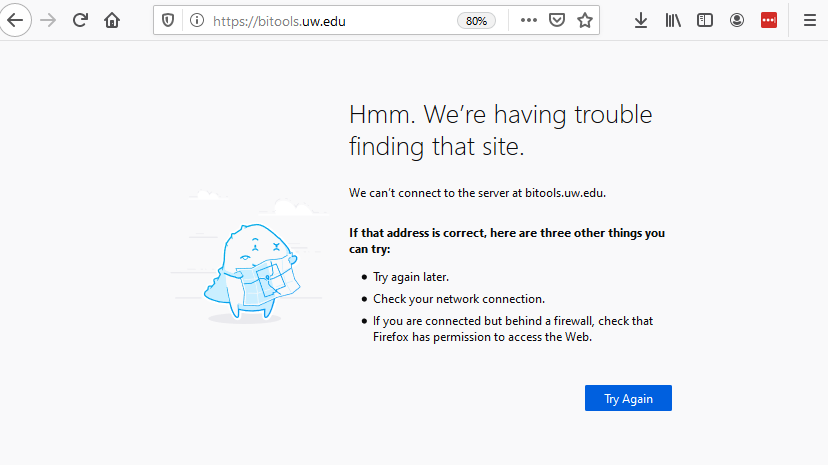
To access Tableau visualizations when you are off-network, you will need to first get on the network. You can use a VPN (Virtual Private Network) to do that. The UW Tableau Team recommends that you use the UW-IT supported Husky OnNet (F5) VPN to do this. Please note, your office may support a VPN other than HuskyOnNet. In that case, please follow the guidance of your local IT expert! You can read about Husky OnNet, download it, and more on IT Connect: Husky OnNet
What exactly is the UW Tableau Transitional Server?
The UW Tableau Transitional Server is an independent Tableau Server instance managed by UW-IT that:
- Serves as a development sandbox for Tableau developers who want to prototype new ideas and share them via the web with a specific audience.
- Enables secure sharing and collaboration during the development of a visualization by leveraging Active Directory groups
- Gives Project administrators autonomy over who can view the visualizations in their projects.
How do I set up a project on the Transitional Server?
Projects on the UW Tableau Transitional Server are centrally managed. UW-IT sets up the initial project, then hands over the responsibility of project and group management over to project administrators (you). To request a project on the Tableau Transitional server, submit a request through the Tableau Project Request Form.
How do I manage permissions for my project on the Tableau Transitional Server?
Tableau project owners, you will self-manage who has access to your project’s visualizations. Using free UW Active Directory (AD) Groups, you can assign people directly to the publisher, editor, and viewer security roles within your Tableau projects (folders where you store your visualizations).
How it works
- You will manage permissions via the UW Groups Service. You will create new groups and add members to them, or re-use an existing Group that has the right members. Review these Groups to make sure they have the membership you expect. You will need to have 3 groups:
- Publisher: People who have permission to publish visualizations
- Editor: People who have permission to create and edit visualizations
- Viewer: People who are allowed to view visualizations, but cannot edit or publish
- Next, complete the Project Request Form here: Tableau Project Request Form. Include your project name and the Group names to be assigned to each security role (publisher, editor, and viewer).
- You will receive an email via help@uw.edu confirming the addition of the Groups. Group members will have access to your project’s visualizations at that time.
- To manage Group membership, use the Groups Service to add or remove members from the Group(s). Note that changes you make to Group membership will take effect on the Tableau Transitional Server during our sync with the Groups service that happen twice per day, once in the morning, and once in the afternoon.
Additional Information
- Group members must have Enterprise Data Warehouse (EDW) access in order to view the visualizations in your project that use EDW data.
- Learn more about Groups Service
- Learn more about publishing to the Tableau Transitional Server under the Sharing and Publishing section here.
Please send questions to help@uw.edu.
What are the permission options for projects?
The Transitional Server employs three security roles for every project: one each for viewing, creating, and publishing workbooks:
- Viewer – the least privileged role; allows viewing workbooks and views, adding comments and tags, filtering, and exporting visualizations to pdf, cross-tab, and images
- Editor (creator) – includes all the permissions of the Viewer role, and can create views/workbooks/dashboards, download existing views/workbooks from the Server, use Web editor mode to change, but not publish changes to the Server
- Publisher – most privileged role; can do everything an Editor can do; can also publish views/workbooks to the Server, modify existing visualizations and re-publish these visualizations to the Server; manage content (move/delete)
Why am I getting errors creating or managing UW Groups?
UW Groups service is supported and maintained by UW-IT Identity and Access Management.
- View Groups web service documentation at UW Groups
- Request Groups assistance: help@uw.edu
How do I publish to the Transitional Server and share my work with colleagues?
- You can find the steps here: How to Publish to the Transitional Server
How long can a visualization live on the Transitional Server?
The Transitional Server is not a permanent home for visualizations. Visualizations published to the Transitional Server are monitored for usage and update activity. The visualization is flagged and its author and the Tableau Administrators may be notified if one of the following conditions is true:
- Visualization has been published but has not been viewed, and has not been modified within the
past 60 days - Visualization is viewed frequently and has not been modified in the past 30 days
- Associated data source(s) have consistently failed to refresh
The Tableau Administrator will request that the author either remove the flagged visualization from the Transitional Server or publish it to the Production Server.
After three unsuccessful attempts to contact the author of the visualization, the visualization will be permanently removed from the Transitional Server.
Why does my workbook have a “Stale Content” tag?
Transitional Server workbooks that have not been accessed in 90+ days are at risk of removal, and will have a “Stale Content” tag applied. To review and retain your content, here’s what you need to do:
- Review “My Content”
- Visit bitools.uw.edu
- On the top right click the letter icon and choose “My Content”
- Choose the three dots under “Actions” and choose “Tags”
- If you see a “stale content” tag for a workbook you wish to retain, simply click the “x” button to remove the tag.
- If you don’t wish to retain a workbook, simply choose “Delete” action.
What other server options are available?
If you are looking to have your dashboard(s) viewable from within the BI Portal , we can work with you adjust the “look and feel” and integrate the dashboards with the Portal, at which time the security will be maintained by Astra role, and no longer through your UW groups. Part of being included in the BI Portal will also mean some additional documentation, particularly providing metadata to allow integration with Knowledge Navigator.
If you are looking to make your dashboard(s) available on the UW External server (so that they can be accessed from outside users), there will likely need to be some additional packaging of workbooks and data sources, and verification that sensitive data is removed or aggregated. Once workbooks are published to the external server, all security is removed, and guest access is enabled at the viewer level. We will provide you with the URL and javascript embed codes, and any user that has the URL or embed code can view the dashboards. Most users that need to maintain some security on external workbooks will use the embed code to embed the workbook within a secured page, and restrict access that way.
What are common Data Source failures?
Data sources must be accessible from the UW Tableau Transitional server, and the server service account “NETID\a_tableau” must have permissions to the source.
Database server permissions
- NETID\a_tableau must have access to the database and all referenced tables when a database is used for a Tableau Data Source.
Network file-share access
- Files must be referenced by UNC path (\\server\share) and not by drive letter.
How can I improve the performance of my Tableau workbook?
- If your workbook’s data source is published as a live connection to the SQL server (e.g. an EDW database), you will get much better performance if you publish this data source as an extract, as outlined at https://help.tableau.com/current/pro/desktop/en-us/extracting_data.htm#create-an-extract. Given that many EDW databases refresh daily from source systems, there is no reason to have a Live connection.
- What’s causing the performance lag is that with a live connection, each time a user interacts with your dashboard (e.g. updates a filter), the dashboard queries the EDW. With an extract, you create a subset of data to support your workbook, make that available on the server, and reduce the number of hops and scope of data being queried.
How do I obtain a Tableau License
See the Tableau Licensing page for more details: Tableau Desktop Licensing
What version of Tableau Desktop should I use?
While Tableau has made strides to increase backward compatibility, we have found occasional issues when publishing to Tableau Server from a later version of Tableau Desktop. As such, we recommend using a version of Tableau Desktop that is at or lower than the current UW Tableau Server.
What is the current Tableau server version?
It is easy to find the current Tableau Server version. Here are the steps:
- Navigate to the Tableau Transitional Server: https://bitools.uw.edu/
- In the top right of the screen, click the question mark icon
- Select “About UW Tableau”
- The pop-up will tell you the latest version, e.g. 2019.2.1
My Tableau Desktop says it’s expiring, what can I do to renew?
If you purchased your Tableau Desktop license from UW-IT and are receiving a warning message that your Tableau Software maintenance expires soon, here’s what you need to know.
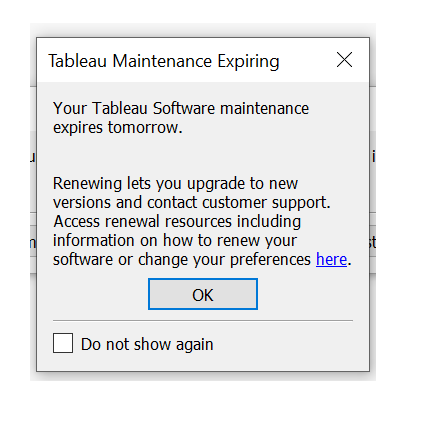
Why are you receiving this message?
You are receiving this message because every year your Tableau Desktop license needs to be renewed. Per our Tableau software agreement, the on-going renewal fee covers support and maintenance of the product for the whole year. All UW-IT purchased Tableau Desktop licenses expire on August 18th.
How to resolve the warning message?
- Open your Tableau Desktop software
- Click on Help, then Manage Product Keys…
- In the Manage Product Keys dialog box, select the key and press “Refresh”
- The warning should disappear next time you open Tableau Desktop
How do I retrieve my current Tableau Desktop or Tableau Creator key?
Details about using the Tableau Customer Portal are available at Tableau Desktop or Creator key information
How do I join the Tableau User Group?
UW-IT hosts an active online and in-person Tableau User Group (TUG) which focuses on training, collaboration and support.
Join the UW TUG group to:
- gain access to the Tableau User Group (TUG) Microsoft Team, which includes instructional resources
- improve your Tableau knowledge and skills
- get input on your data visualizations
- post and participate in online discussion threads
- stay abreast of upcoming TUG meetings, events, and news
To join the UW TUG and gain access to the TUG’s online home, you must first use UW’s Groups service to join the group called “UW Tableau Users”, as pictured below.
- Go to the UW Tableau Users group page
- Click ‘Join this group’

- After joining the group, you will have access to the online UW Tableau User Group Community.
How do I Publish Visualizations to the UW Tableau External Server?
Before You Start
Please read the following policies to familiarize yourself with guidelines around the use of UW Tableau External Server:
- Usage of Tableau External Server – DMC Guideline
- Safe Aggregation of Personally Identifiable Information – DMC Guideline
- UW Installation of Tableau External – DMC Guideline
Publishing Visualizations to the UW Tableau External Server
Request Project Name
You will need to provide the following in order to set proper permissions:
- Name of the Project Space (usually the name of your unit or department)
- Contact person for your project space
Request Deployment
- Publish your workbook to the Transitional Server as a packaged workbook. More information is available at How To: Package Workbook
- Submit deployment request to help@uw.edu to move your visualization\workbook(s) to the External Server
- Provide name(s) of the visualization\workbook together with the name of the project hosting these visualizations on the Transitional server
Sharing Your Visualization
Upon successful deployment to the UW Tableau External Server, you will receive a confirmation email with link(s) to your visualizations. You can then share your visualization with your constituents via your website or other methods, such as a slide deck. The link below provides instructions on how to embed Tableau views and dashboards.
How do I embed my Tableau Workbook in a Website?
Additional Information
- Currently all data sources must be extracts of your data.
- None of the visualizations can be downloaded to a viewer’s local desktop
- Dashboards must display aggregated data, so that personally identifiable information data cannot be revealed
- If the dashboard has the level of data that could lead to identification of an individual, Safe Aggregation technique must be implemented at the visualization\workbook level. See Safe Aggregation of Personally Identifiable Information
Color Palette
All dashboards will need to comply with the University’s color palette standards. You can find information on how to use UW defined color palette: https://canvas.uw.edu/courses/873898/pages/color-palettes-uw-and-customized
How do I embed my Tableau Workbook in a Website?
The following steps may be used to embed a view or dashboard in a webpage.
Prerequisite: The view or dashboard (Tableau Workbook) must be published to the UW Tableau External Server. The data must be available without requiring a data source password prompt (i.e. embedded account and password).
Select an approach
In your webpage, you will need to insert an embed code. To do so you can take one of two approaches:
- Use Tableau JavaScript:Use the embed code that Tableau generates as the starting point for your own code, adding or editing object parameters that control the toolbar, tabs, and more. The default embed code, which relies on a Tableau JavaScript file, is also the only way to control the load order of multiple embedded views.
- Specify the View URL:Embed a view using an Iframe or Image tag, where the source is the URL from the Link box of the Share dialog box. You may want to do this if you can’t use JavaScript on your website.
Example of embedding a view using JavaScript
- Navigate to the view that you want to publish. If you don’t know the link to your visualization, request one by emailing help@uw.edu
- On the top right corner, click on ‘Share’ to open the share dialog box.

- Select and copy the code under ‘Embed code’.

Below is the embed code for this view.<script type=’text/javascript’ src=’https://tableau.washington.edu/javascripts/api/viz_v1.js’></script>
<div class=’tableauPlaceholder’ style=’width: 1912px; height: 852px;’>
<object class=’tableauViz’ width=’1912′ height=’852′ style=’display:none;’>
<param name=’host_url’ value=’https%3A%2F%2Ftableau.washington.edu%2F’ />
<param name=’site_root’ value=” /><param name=’name’ value=’Superstore/Overview’ />
<param name=’tabs’ value=’yes’ /><param name=’toolbar’ value=’yes’ />
<param name=’showShareOptions’ value=’true’ /></object></div>The source for the <script> tag is the URL for the UW Tableau External Server JavaScript file, viz_v1.js. The JavaScript file handles assembling the full URL of the view that’s displayed for your users. The name and site_root object parameters are the only required parameters; all other parameters are optional.
- Insert this code in the code for your webpage.
Example of embedding the view using IFrame
- Insert the below code in your webpage code.
<iframe src=”<Source URL>” width=”800″ height=”600″></iframe> - Replace the text in red with the URL of the view.
How to find the URL for a view or dashboard?
Follow steps 1-3 mentioned above in the JavaScript example.
– Select and copy the URL under ‘Link’ in the share dialogue box.

Below is the URL for this view.
https://tableau.washington.edu/views/Superstore/Overview?:embed=y&:showShareOptions=true&:display_count=no&:showVizHome=no
Example:
<iframe src=”https://tableau.washington.edu/views/Superstore/Overview?:embed=y&:showShareOptions=true&:display_count=no&:showVizHome=no” width=”800″ height=”600″></iframe>
The embed URL parameter is required, and you can optionally include parameters that control the toolbar and revert options, among others. You can also add filters to the URL that control the specific data that shows when a view is loaded.
Note: When you embed a view, you should define a width and height that the view will be displayed in. If you do not do this, the client browser will arbitrarily pick a width and height.
List of Embed Parameters
You can embed a view using either an Iframe tag, which uses URL parameters, or a JavaScript tag, which uses object parameters. The following table lists both sets of parameters and how to use them.

What Tableau help and support is available to the UW Tableau Community?
Whether you are new to Tableau or have been working with it for years, you will have questions along the way. We try to answer many of the most common questions in this FAQ. However, if you still have questions, you should write a help@uw.edu ticket for help with any of the following:
- UW Tableau Servers
- UW Tableau Server project permissions
- Publishing data sources and scheduling refreshes
Please be descriptive in your subject line to make sure your question gets to the right team! Include something like, “Tableau: [Keywords that summarize your problem]”.
We also get many requests for help for with things like:
- Connecting Tableau to third party vendor data sources
- Building special breakdowns and calculations into a dashboard
- Recommendations on the best way to visualize a specific kind of data
Troubleshooting this type of work is outside of the scope of support that our team offers. The best resource for how to troubleshoot specific problems is the Tableau Learning pages or the Tableau Community Forum: https://www.tableau.com/community
Please note that your Tableau Desktop License monthly fee includes free support and maintenance from Tableau staff, so feel free to reach out to them if you hit a wall: https://www.tableau.com/support/desktop?_ga=2.58139306.1402460053.1571435706-401298278.1569846890
What additional training options are available?
UW-IT does not currently offer Tableau training. Tableau does offer a range of training options, from free online videos to full classroom and certification training, but these options are not maintained through UW. For more information, refer to Tableau’s Free Training Videos.
Other available resources include:
- Reporting and Analytics’ guided tour of Tableau training

- O’Reilly Online Books (Free access when signing in with your UW NetID)
- LinkedIn Learning (Free access when signing in with your UW NetID)
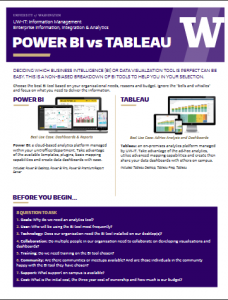
What is the difference between Tableau and Power BI
In recent year Microsoft introduced Power BI as a data visualization toolset that competes directly with Tableau. If you’re interested in comparing the two tools, we’ve put together a comparison here in PDF format:
In short, UW-IT Enterprise Reporting and Analytics supports Tableau at the UW enterprise level. We maintain the server environments and work with customers to troubleshoot technical questions. We have also built a community of practice around Tableau with our Tableau User Group. If you decide to go with Tableau, we deliver high levels of service, security, and availability.
If you decide to go the Power BI route, it is managed by the UW-IT MSCA (Microsoft Collaborative Applications), the UW UW UWare web page that details information related to Power BI is here: Power BI