This page helps users resolve the most common questions about working with reports, dashboards, and cubes available in the BI Portal or UW Profiles. If your question isn’t answered here, please write help@uw.edu.
Access
Accessible Accordion
Not sure if you have access to Enterprise Data Warehouse (EDW) data and tools? Or want to find out what kind of access you have? Any UW employee can use ASTRA to view their EDW access.
Look under the Application column – you have access to EDW data, reports, cubes, and dashboards if you see EDW listed. The data you can access is governed by the role to which you have been assigned. In the example above, the user has been assigned to the EDW Administrator role. Note: you may have been granted access to more than one role.
If you need to request new or different access to EDW, visit the Request Access page.
In addition to ASTRA steps described above, there are other ways to explore your access, which are outlined on this page in our wiki: Manage Access.
Note: You must be logged into Husky OnNet (VPN) in order to access this video. For more information, refer to Husky OnNet.
Enterprise Reporting and Analytics hosts monthly webinars on Zoom to help users understand the data products we support. These webinars are free and open to the Enterprise Data User Community.
Attend the Webinar to:
Learn about data and reporting tools available on the BI Portal.
Learn about Academics, Finance, or Research topics.
See demonstrations of how users like you use data tools at the UW.
The links below allow you to join one or more of the UW Groups we have set up. These groups are based on subject area. If you’re interested in finance topics, then join the Finance Group. If you’re interested in research, then join the Research Group. Join both groups if you’re interested in both finance and research. Once you sign up for a group, you’ll receive webinar invitations on that topic and will always know when webinars relevant to your work are happening.
Our office does not currently have any resources dedicated to hosting in-person trainings. If you would like more training on Excel or other data tools, we recommend you explore the following:
You must set up a Virtual Private Network (VPN) to access reports, cubes, dashboards or Enterprise Data Warehouse data from off campus. UW provides this secure remote connection through Husky OnNet. This service is provided at no additional cost to UW students, faculty and staff as part of the Basic Bundle of services covered under the Technology Recharge Fee. To access the service, go to the Husky OnNet UWare page.
Some of the most common issues users report regarding report-running are:
Logging In
To access cubes or reports, you will need to access the UW NetId domain using your UW NetID username and password.
See the Logging In frequently asked question
Data Unavailable
When running a report, you may encounter an error message that resembles the image below.
Cryptic? Yes. Helpful? Not really. But the bottom line is that a database needed by the report isn’t available and one of two things is happening:
The database is being loaded with data
The database is unavailable due to maintenance or an unexpected outage
The Last Loaded Column usually shows the the date and time that the database is loaded. If the database is loading (usually at night or early morning) , you’ll see the “Loading…” message in the Last Loaded column of the Data Availability Summary.
Is Data Current?
The Load Frequency is the scheduled frequency of the database being uploaded, therefore (Excluding Legacy HEPPS Databases) if the frequency is daily, the Last Loaded date should never be , greater than two days old. For the the Legacy HEPPS, data loads were frozen post Workday release in 2017. No database is loaded more than once a day.
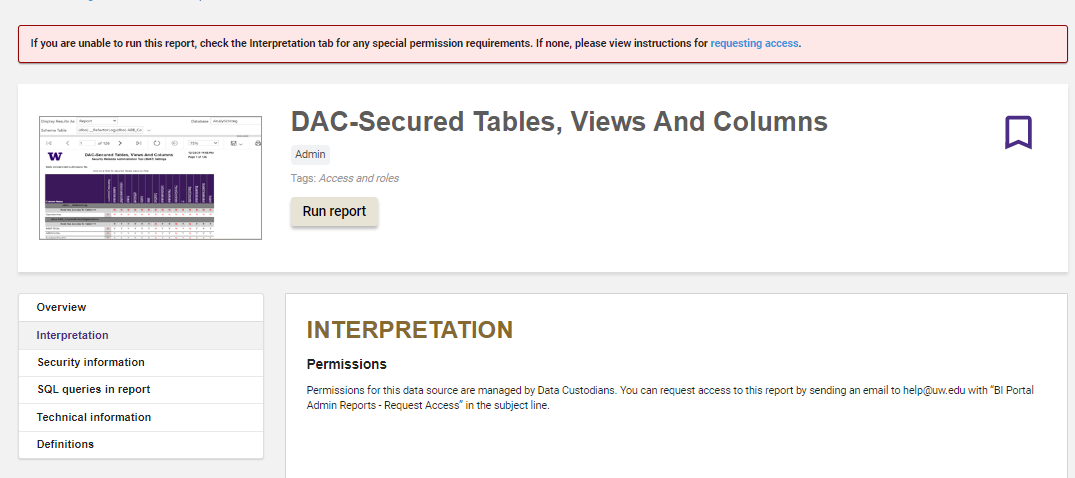
How can I tell if I have access to a Report?
When attempting to run a report if you see a pink caption as shown in the image below, it indicates that the report is not accessible to the user’s Astra Role. Go to the Interpretation Tab to check permissions and instructions on how to requess access.
Why are there all null values in one of my columns?
When a report runs, but there are fields in which all the values of a column are null, either all the values for a particular run are null or the user does not have access to that particular data item.
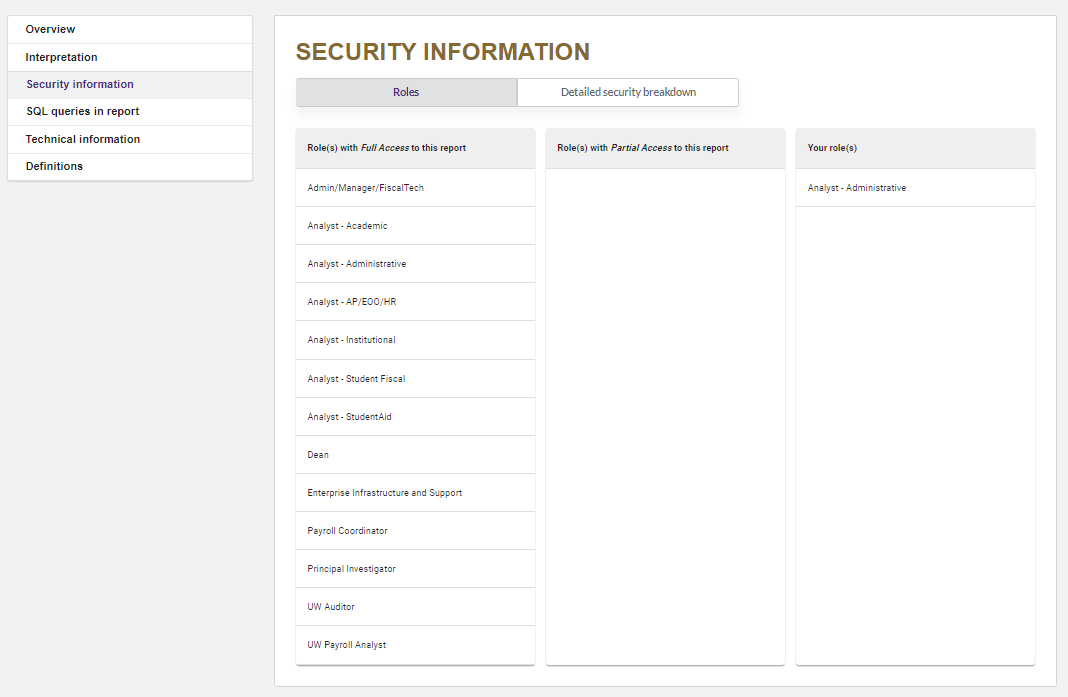
To check if you have full or partial access to a BIPortal Report, select the “Security Information” tab. It indicates which Astra roles have Full Access, Partial Access and the Astra Role that you have.
Alerts
Check the BI Portal header to see if an outage message has been posted. The message will list the databases that are unavailable along with an estimated time they should be available again. If you don’t see a message there, please send an email to help@uw.edu to let us know about the issue you’ve encountered.
If you are using Internet Explorer for your web browser and are having trouble loading a BI Portal report, we recommend that you try a different browser.
The browsers we currently support include:
Firefox
Chrome
Cubes
Accessible Accordion
A data cube is a powerful analysis tool, which allows you to quickly and easily slice and dice data across multiple dimensions, in a single view. To learn more about cubes, including their benefits over traditional analysis tools, such as reports, refer to the What is a Cube introductory video.
Note: You must be logged into Husky OnNet (VPN) in order to access this video. For more information, refer to Husky OnNet.
You do not need to request new access to use cubes if you already have access to run EDW reports and query data. If you need to request access, you can do so at the Request Access page.
Access for cubes is managed the same as data in the Enterprise Data Warehouse (EDW) and/or BI Portal.
You are already connected to the UW Network. No action is required.
Remote…
Connect to the UW Network via a Virtual Private Network (VPN), such as Husky OnNet. For more information, refer to Husky OnNet.
Select an analysis tool and connect.
Accessible Accordion
Accessible Accordion
A template is an Excel Workbook with an established connection to a specific cube; it already has a pivot table (which is what allows you to work with the cube); and it has been populated with one measure.
Refer to the Templates/Base Workbooks section of the following resource pages for available templates:
Download the template to your computer. A popup may also display to prompt you to open the file.
Open the workbook and explore. If prompted for authentication, enter your UW NetID and password.
A template is not available…
Follow the steps under Connect WITHOUT a template or base workbook below.
Open Microsoft Excel on your computer and start a new blank workbook.
Display the Data Connection Wizard:
If using…
Then…
Excel 2016
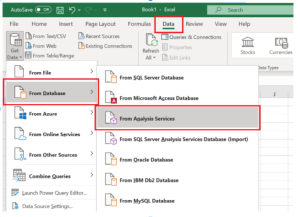
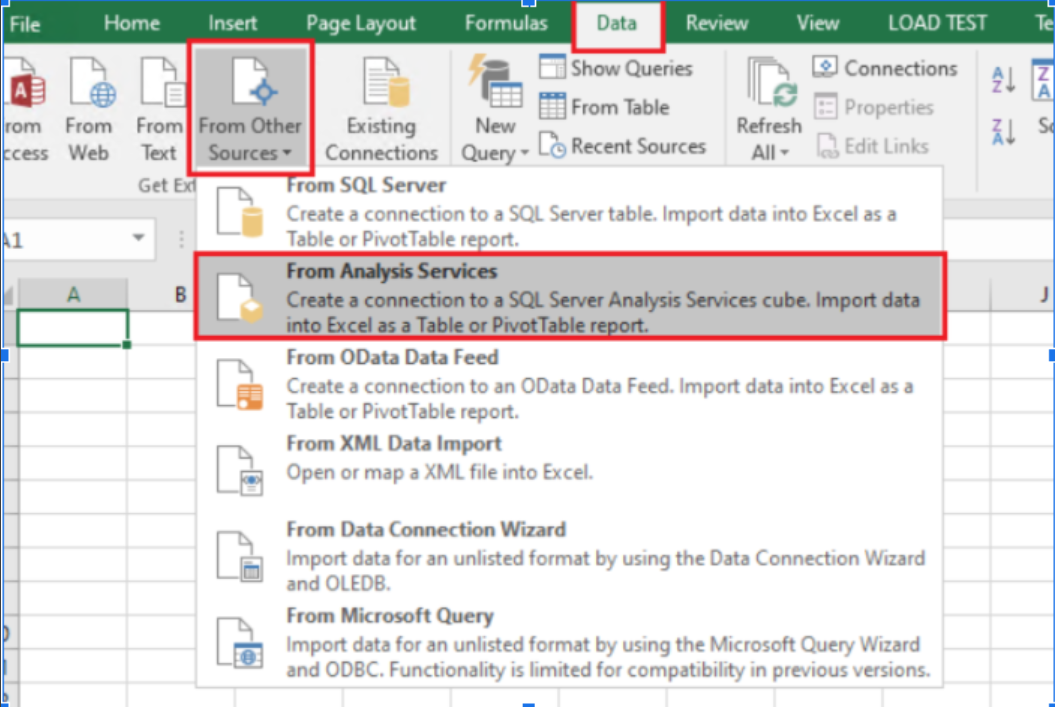
Select the Data tab, then From Other Sources, and then From Analysis Services.Selecting “From Analysis Services” in Excel 2016
Excel 365
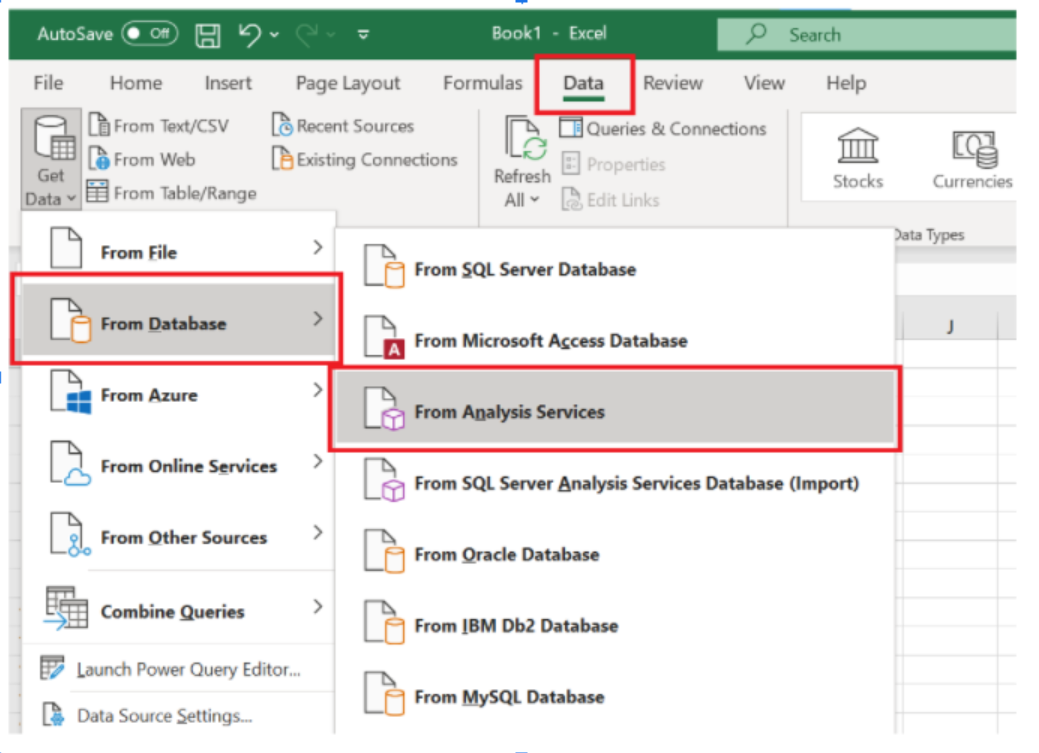
Select the Data tab, then Get Data, then From Database, and then From Analysis Services.Selecting “From Analysis Services” in Excel 365
Field
Description
Server Name
Enter cubes.uw.edu.
Log on credentials
Select Use Windows Authentication. Tip: If this does not work, select Use the following User Name and Password, and then enter the following:
User Name: Enter netid\your UW NetID
Password: Enter your password.Populate the Connect to Database Server window as follows and then click Next.
Select the cube:
If using…
Then…
Excel 2016
From the database dropdown, select the applicable cube, then select Model, and then click Finish.
Excel 365
From the database dropdown, select the applicable cube, and then click Finish.
A dialog to import the data should display.
Select where you want the table to be located on the worksheet (for example, cell A1) and then click OK. You are now connected to the cube. You only need to perform these connection steps once per cube. To access this connection when opening a new workbook, select the Data tab, and then click Existing Connections.
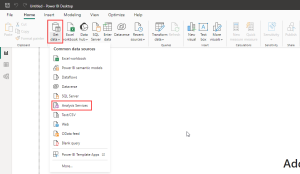
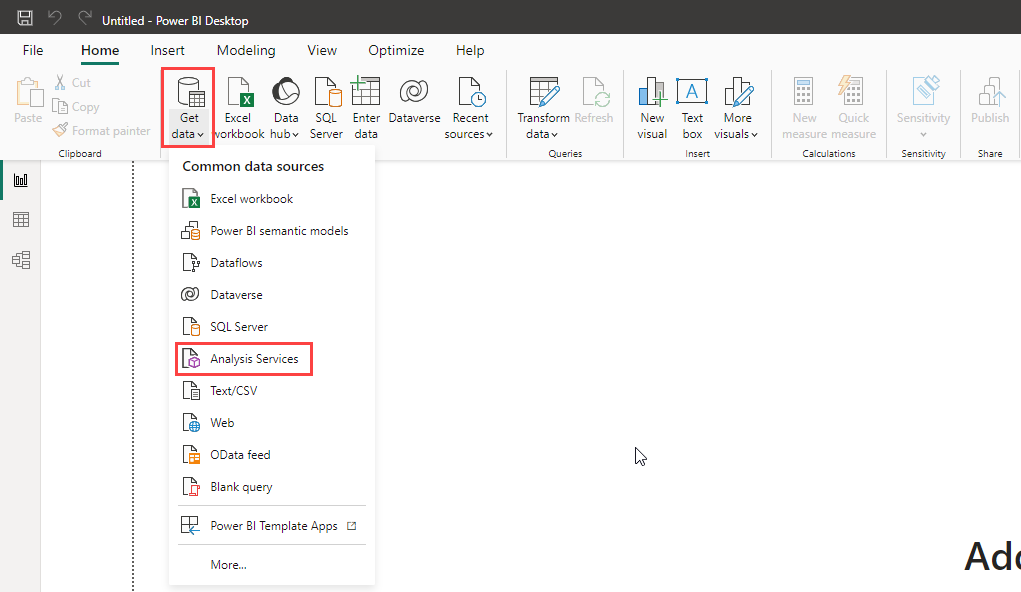
Open Power BI Desktop.
On the Home ribbon, select Get Data, then Analysis Services. Selecting “Analysis Services” in Power BI
Populate the SQL Server Analysis Services database window as follows and then click OK.
Field/Button
Description
Server
Enter cubes.uw.edu.
Radio button
Select Connect live.
On the Windows tab of the Access SQL Server Analysis Services window, select Use my current credentials, and then click Connect.
In the left pane of the Navigator window, expand the cube you want to select, select the model or view (if applicable), and then click OK. You are now connected to the cube. You only need to perform these connection steps once per cube. To access this connection when opening a new workbook, select the Data tab, and then click Existing Connections. For more information, refer to Connect to Analysis Services tabular data in Power BI Desktop.
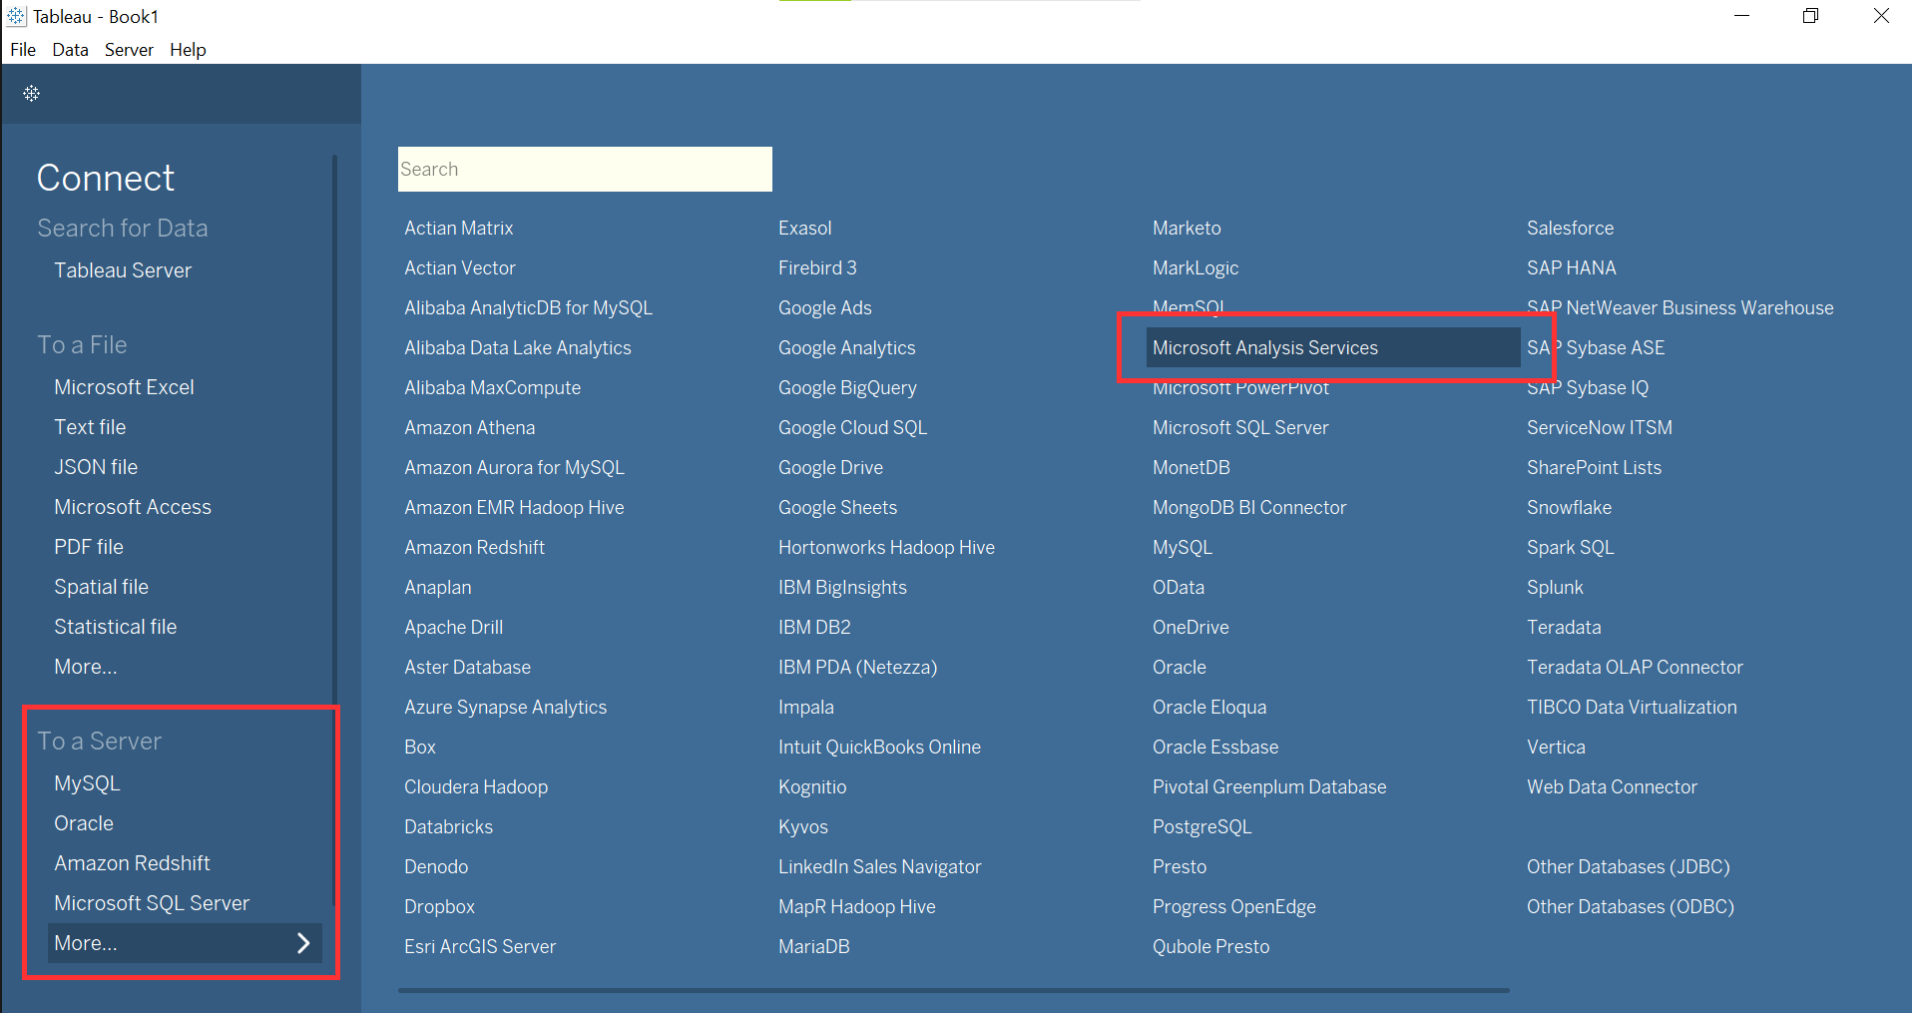
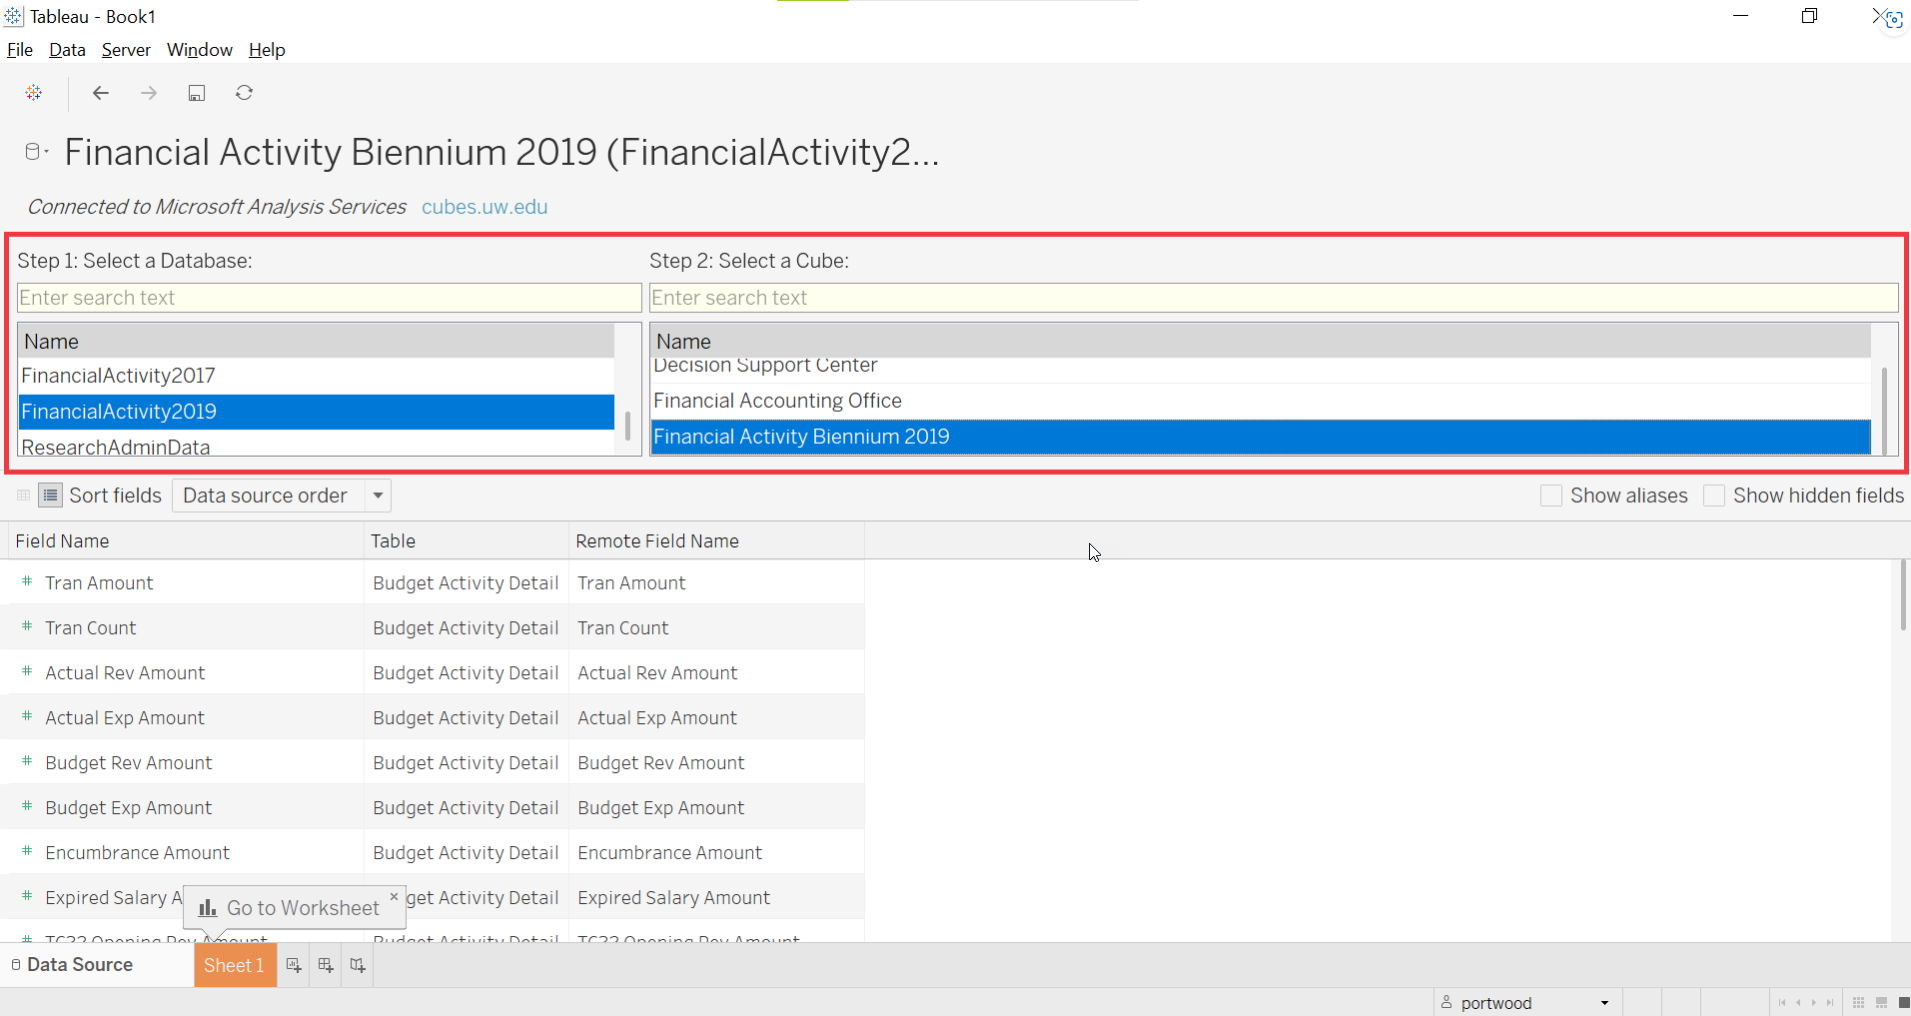
Open Tableau Desktop.
From the “To a Server” section, select More, and then Microsoft Analysis Services. Selecting “Microsoft Analysis Services” in Tableau
On the Microsoft Analysis Services window, select the following, and then click Sign In:
Select Server and enter cubes.uw.edu into the text field.
Select Windows Authentication.
Now that you are connected to the server, choose the Database and Cube you want to explore. An example of a cube selection
The next time you open Tableau and choose Microsoft Analysis Services, it will default to these connection details.
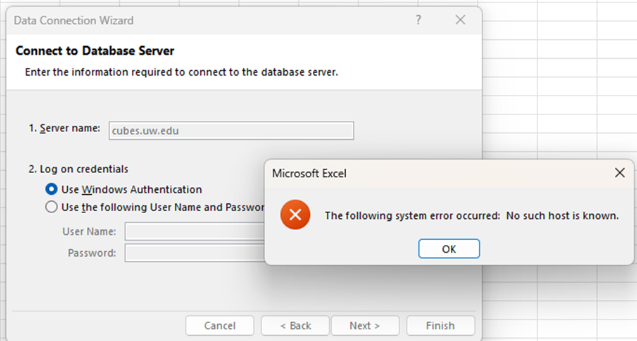
Note: The above instructions assume you are using a computer that is connected to your UW NetID environment. If this is not the case (for example, you are trying to connect from your personal computer), you may see an error that looks like this:
A data cube displays data in two groupings: measures and dimensions.
Measures: These are the data elements that can be counted. Things like a count of research awards, or the sum of budget expenditures.
Dimensions: Some people refer to these as the “slicers” or “breakdowns”. These are the data elements that allow you see a fact sliced by a particular dimension. For example, you can look at the count of research awards by Department using the Financial Organization Dimension.
However, it’s very important to know that not all Measures can be sliced by all Dimensions. This makes sense conceptually. In the ResearchAdminData cube for instance:
You cansee a count of research proposals sliced by the proposal IDs because all proposals have proposal IDs.
You cannot see a count of awards sliced by the proposal IDs in the proposals dimensions because not all awards have proposal IDs. Conceptually, and in the data, the measures don’t have a relationship to that dimension.
When a user joins a measure to a dimension that doesn’t have any underlying relationship, the cube will return erroneous results, like a table full of duplicated values. This doesn’t mean the cube is broken, it just means those two elements can’t be joined.
Our partners in the Office of Research and Information Services (ORIS) put together this handy document to demonstrate this concept: RAD Cube Facts and Dimensions.
Note: The above document from ORIS uses the term “facts” instead of “measures”. In this case, the terms “facts” and “measures” are interchangeable.
Dashboards
Accessible Accordion
To learn more about Tableau, including how to get a license, please check out the Tableau pages on this site: Data Dashboards (Tableau)
General Information
Accessible Accordion
First check Knowledge Navigator, while not every term is yet defined, if it is, it will have the institutional definition, lineage, and usage.
Use UW Connect Finance to search knowledge base articles and submit requests.
Reports in the BI Portal and associated data, excluding reports tagged with “Workday Financial”…
Entries in the BI Portal Catalog (for example, information on the report detail pages, metadata, links, etc.), including catalog entries for reports tagged with “Workday Financial”…
Contact help@uw.edu with “BI Portal Reports” in the subject line.
Include a description of the report, how and how often it would be used, what other staff would be interested in using it, and you contact information.